Immigrants from Uzbekistan vs Immigrants from Congo 1 or more Vehicles in Household
COMPARE
Immigrants from Uzbekistan
Immigrants from Congo
1 or more Vehicles in Household
1 or more Vehicles in Household Comparison
Immigrants from Uzbekistan
Immigrants from Congo
73.4%
1 OR MORE VEHICLES IN HOUSEHOLD
0.0/ 100
METRIC RATING
337th/ 347
METRIC RANK
90.0%
1 OR MORE VEHICLES IN HOUSEHOLD
71.2/ 100
METRIC RATING
157th/ 347
METRIC RANK
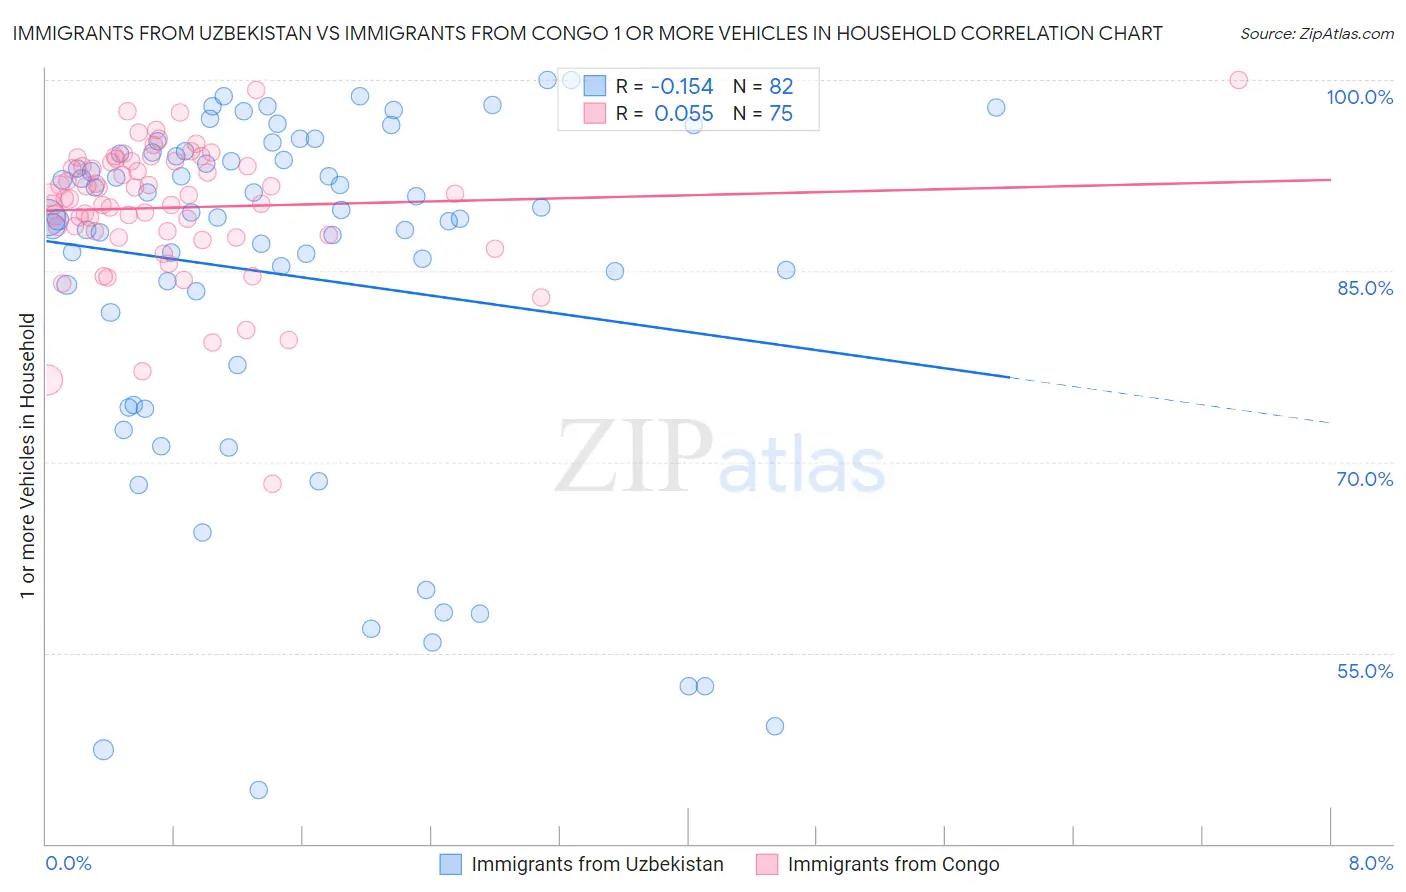
Immigrants from Uzbekistan vs Immigrants from Congo 1 or more Vehicles in Household Correlation Chart
The statistical analysis conducted on geographies consisting of 118,706,562 people shows a poor negative correlation between the proportion of Immigrants from Uzbekistan and percentage of households with 1 or more vehicles available in the United States with a correlation coefficient (R) of -0.154 and weighted average of 73.4%. Similarly, the statistical analysis conducted on geographies consisting of 92,096,115 people shows a slight positive correlation between the proportion of Immigrants from Congo and percentage of households with 1 or more vehicles available in the United States with a correlation coefficient (R) of 0.055 and weighted average of 90.0%, a difference of 22.7%.
1 or more Vehicles in Household Correlation Summary
| Measurement | Immigrants from Uzbekistan | Immigrants from Congo |
| Minimum | 44.2% | 68.3% |
| Maximum | 100.0% | 100.0% |
| Range | 55.8% | 31.7% |
| Mean | 84.6% | 90.0% |
| Median | 89.2% | 90.9% |
| Interquartile 25% (IQ1) | 81.7% | 87.9% |
| Interquartile 75% (IQ3) | 94.2% | 93.6% |
| Interquartile Range (IQR) | 12.4% | 5.7% |
| Standard Deviation (Sample) | 14.2% | 5.4% |
| Standard Deviation (Population) | 14.1% | 5.3% |
Similar Demographics by 1 or more Vehicles in Household
Demographics Similar to Immigrants from Uzbekistan by 1 or more Vehicles in Household
In terms of 1 or more vehicles in household, the demographic groups most similar to Immigrants from Uzbekistan are Vietnamese (73.8%, a difference of 0.62%), Barbadian (74.0%, a difference of 0.82%), Immigrants from Bangladesh (74.3%, a difference of 1.3%), Inupiat (71.5%, a difference of 2.6%), and Guyanese (70.8%, a difference of 3.6%).
| Demographics | Rating | Rank | 1 or more Vehicles in Household |
| Immigrants | Trinidad and Tobago | 0.0 /100 | #330 | Tragic 76.8% |
| West Indians | 0.0 /100 | #331 | Tragic 76.4% |
| Trinidadians and Tobagonians | 0.0 /100 | #332 | Tragic 76.3% |
| Immigrants | Ecuador | 0.0 /100 | #333 | Tragic 76.2% |
| Immigrants | Bangladesh | 0.0 /100 | #334 | Tragic 74.3% |
| Barbadians | 0.0 /100 | #335 | Tragic 74.0% |
| Vietnamese | 0.0 /100 | #336 | Tragic 73.8% |
| Immigrants | Uzbekistan | 0.0 /100 | #337 | Tragic 73.4% |
| Inupiat | 0.0 /100 | #338 | Tragic 71.5% |
| Guyanese | 0.0 /100 | #339 | Tragic 70.8% |
| Dominicans | 0.0 /100 | #340 | Tragic 70.7% |
| Immigrants | Barbados | 0.0 /100 | #341 | Tragic 70.6% |
| Immigrants | Guyana | 0.0 /100 | #342 | Tragic 70.6% |
| British West Indians | 0.0 /100 | #343 | Tragic 70.4% |
| Immigrants | Dominican Republic | 0.0 /100 | #344 | Tragic 68.6% |
Demographics Similar to Immigrants from Congo by 1 or more Vehicles in Household
In terms of 1 or more vehicles in household, the demographic groups most similar to Immigrants from Congo are Brazilian (90.0%, a difference of 0.0%), Australian (90.0%, a difference of 0.020%), South African (90.0%, a difference of 0.030%), Immigrants from Indonesia (90.0%, a difference of 0.040%), and New Zealander (90.1%, a difference of 0.050%).
| Demographics | Rating | Rank | 1 or more Vehicles in Household |
| Immigrants | Micronesia | 75.9 /100 | #150 | Good 90.1% |
| Immigrants | Bosnia and Herzegovina | 75.4 /100 | #151 | Good 90.1% |
| Tlingit-Haida | 74.3 /100 | #152 | Good 90.1% |
| New Zealanders | 73.8 /100 | #153 | Good 90.1% |
| Immigrants | Uganda | 73.8 /100 | #154 | Good 90.1% |
| Immigrants | Immigrants | 73.6 /100 | #155 | Good 90.1% |
| Australians | 72.4 /100 | #156 | Good 90.0% |
| Immigrants | Congo | 71.2 /100 | #157 | Good 90.0% |
| Brazilians | 71.0 /100 | #158 | Good 90.0% |
| South Africans | 69.7 /100 | #159 | Good 90.0% |
| Immigrants | Indonesia | 68.8 /100 | #160 | Good 90.0% |
| Salvadorans | 68.7 /100 | #161 | Good 90.0% |
| Spanish American Indians | 67.0 /100 | #162 | Good 89.9% |
| Immigrants | Austria | 65.5 /100 | #163 | Good 89.9% |
| Comanche | 63.4 /100 | #164 | Good 89.9% |