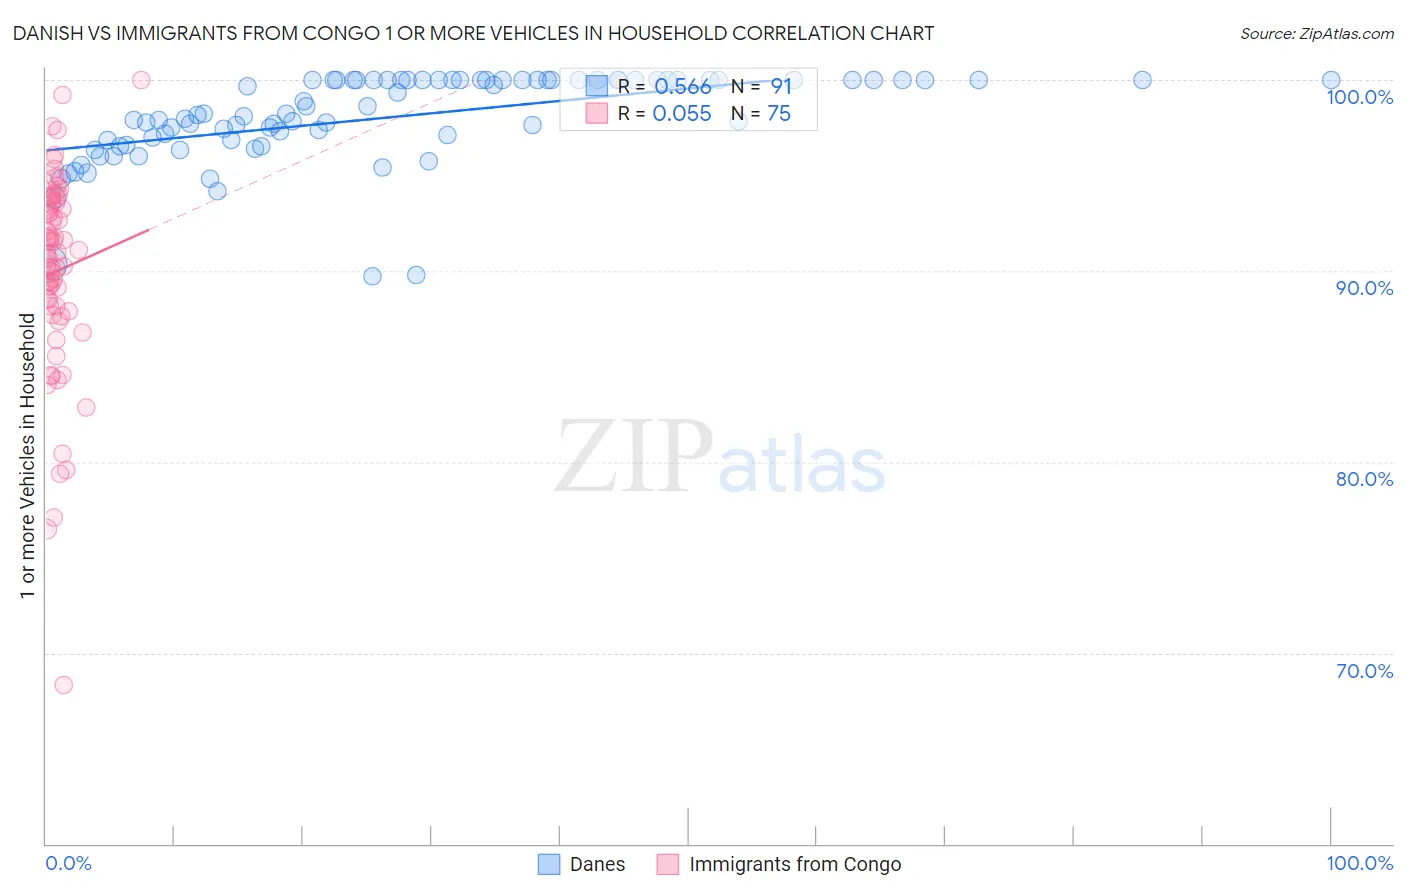
Danish vs Immigrants from Congo 1 or more Vehicles in Household
COMPARE
Danish
Immigrants from Congo
1 or more Vehicles in Household
1 or more Vehicles in Household Comparison
Danes
Immigrants from Congo
93.5%
1 OR MORE VEHICLES IN HOUSEHOLD
100.0/ 100
METRIC RATING
6th/ 347
METRIC RANK
90.0%
1 OR MORE VEHICLES IN HOUSEHOLD
71.2/ 100
METRIC RATING
157th/ 347
METRIC RANK
Danish vs Immigrants from Congo 1 or more Vehicles in Household Correlation Chart
The statistical analysis conducted on geographies consisting of 473,956,098 people shows a substantial positive correlation between the proportion of Danes and percentage of households with 1 or more vehicles available in the United States with a correlation coefficient (R) of 0.566 and weighted average of 93.5%. Similarly, the statistical analysis conducted on geographies consisting of 92,096,115 people shows a slight positive correlation between the proportion of Immigrants from Congo and percentage of households with 1 or more vehicles available in the United States with a correlation coefficient (R) of 0.055 and weighted average of 90.0%, a difference of 3.9%.
1 or more Vehicles in Household Correlation Summary
| Measurement | Danish | Immigrants from Congo |
| Minimum | 89.7% | 68.3% |
| Maximum | 100.0% | 100.0% |
| Range | 10.3% | 31.7% |
| Mean | 98.0% | 90.0% |
| Median | 98.2% | 90.9% |
| Interquartile 25% (IQ1) | 96.9% | 87.9% |
| Interquartile 75% (IQ3) | 100.0% | 93.6% |
| Interquartile Range (IQR) | 3.1% | 5.7% |
| Standard Deviation (Sample) | 2.3% | 5.4% |
| Standard Deviation (Population) | 2.3% | 5.3% |
Similar Demographics by 1 or more Vehicles in Household
Demographics Similar to Danes by 1 or more Vehicles in Household
In terms of 1 or more vehicles in household, the demographic groups most similar to Danes are Yakama (93.6%, a difference of 0.020%), German (93.6%, a difference of 0.12%), Norwegian (93.7%, a difference of 0.16%), Scottish (93.4%, a difference of 0.19%), and Swedish (93.3%, a difference of 0.23%).
| Demographics | Rating | Rank | 1 or more Vehicles in Household |
| Luxembourgers | 100.0 /100 | #1 | Exceptional 94.8% |
| English | 100.0 /100 | #2 | Exceptional 93.8% |
| Norwegians | 100.0 /100 | #3 | Exceptional 93.7% |
| Germans | 100.0 /100 | #4 | Exceptional 93.6% |
| Yakama | 100.0 /100 | #5 | Exceptional 93.6% |
| Danes | 100.0 /100 | #6 | Exceptional 93.5% |
| Scottish | 100.0 /100 | #7 | Exceptional 93.4% |
| Swedes | 100.0 /100 | #8 | Exceptional 93.3% |
| Scotch-Irish | 100.0 /100 | #9 | Exceptional 93.3% |
| Dutch | 100.0 /100 | #10 | Exceptional 93.3% |
| Czechs | 100.0 /100 | #11 | Exceptional 93.3% |
| Scandinavians | 100.0 /100 | #12 | Exceptional 93.1% |
| Whites/Caucasians | 100.0 /100 | #13 | Exceptional 93.1% |
| Irish | 100.0 /100 | #14 | Exceptional 93.1% |
| Mexicans | 100.0 /100 | #15 | Exceptional 93.0% |
Demographics Similar to Immigrants from Congo by 1 or more Vehicles in Household
In terms of 1 or more vehicles in household, the demographic groups most similar to Immigrants from Congo are Brazilian (90.0%, a difference of 0.0%), Australian (90.0%, a difference of 0.020%), South African (90.0%, a difference of 0.030%), Immigrants from Indonesia (90.0%, a difference of 0.040%), and New Zealander (90.1%, a difference of 0.050%).
| Demographics | Rating | Rank | 1 or more Vehicles in Household |
| Immigrants | Micronesia | 75.9 /100 | #150 | Good 90.1% |
| Immigrants | Bosnia and Herzegovina | 75.4 /100 | #151 | Good 90.1% |
| Tlingit-Haida | 74.3 /100 | #152 | Good 90.1% |
| New Zealanders | 73.8 /100 | #153 | Good 90.1% |
| Immigrants | Uganda | 73.8 /100 | #154 | Good 90.1% |
| Immigrants | Immigrants | 73.6 /100 | #155 | Good 90.1% |
| Australians | 72.4 /100 | #156 | Good 90.0% |
| Immigrants | Congo | 71.2 /100 | #157 | Good 90.0% |
| Brazilians | 71.0 /100 | #158 | Good 90.0% |
| South Africans | 69.7 /100 | #159 | Good 90.0% |
| Immigrants | Indonesia | 68.8 /100 | #160 | Good 90.0% |
| Salvadorans | 68.7 /100 | #161 | Good 90.0% |
| Spanish American Indians | 67.0 /100 | #162 | Good 89.9% |
| Immigrants | Austria | 65.5 /100 | #163 | Good 89.9% |
| Comanche | 63.4 /100 | #164 | Good 89.9% |