Croatian vs Immigrants from Asia 1 or more Vehicles in Household
COMPARE
Croatian
Immigrants from Asia
1 or more Vehicles in Household
1 or more Vehicles in Household Comparison
Croatians
Immigrants from Asia
91.9%
1 OR MORE VEHICLES IN HOUSEHOLD
99.8/ 100
METRIC RATING
64th/ 347
METRIC RANK
89.3%
1 OR MORE VEHICLES IN HOUSEHOLD
22.8/ 100
METRIC RATING
199th/ 347
METRIC RANK
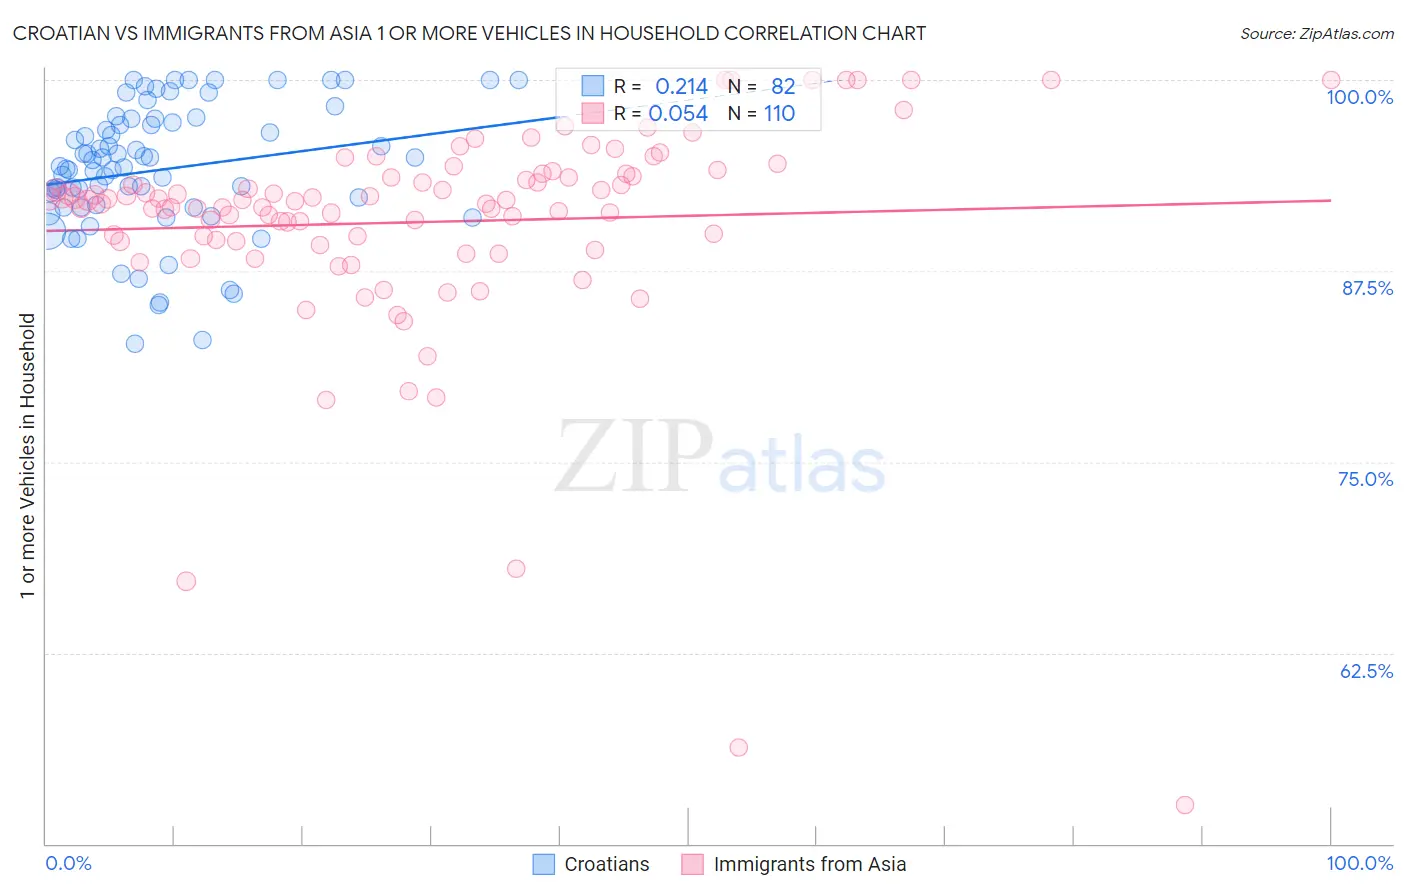
Croatian vs Immigrants from Asia 1 or more Vehicles in Household Correlation Chart
The statistical analysis conducted on geographies consisting of 375,584,731 people shows a weak positive correlation between the proportion of Croatians and percentage of households with 1 or more vehicles available in the United States with a correlation coefficient (R) of 0.214 and weighted average of 91.9%. Similarly, the statistical analysis conducted on geographies consisting of 548,543,467 people shows a slight positive correlation between the proportion of Immigrants from Asia and percentage of households with 1 or more vehicles available in the United States with a correlation coefficient (R) of 0.054 and weighted average of 89.3%, a difference of 2.9%.
1 or more Vehicles in Household Correlation Summary
| Measurement | Croatian | Immigrants from Asia |
| Minimum | 82.7% | 52.6% |
| Maximum | 100.0% | 100.0% |
| Range | 17.3% | 47.4% |
| Mean | 94.1% | 90.7% |
| Median | 94.3% | 92.1% |
| Interquartile 25% (IQ1) | 91.7% | 89.4% |
| Interquartile 75% (IQ3) | 97.2% | 93.7% |
| Interquartile Range (IQR) | 5.5% | 4.3% |
| Standard Deviation (Sample) | 4.2% | 7.3% |
| Standard Deviation (Population) | 4.2% | 7.2% |
Similar Demographics by 1 or more Vehicles in Household
Demographics Similar to Croatians by 1 or more Vehicles in Household
In terms of 1 or more vehicles in household, the demographic groups most similar to Croatians are Chinese (91.9%, a difference of 0.010%), Immigrants from India (91.9%, a difference of 0.030%), Thai (91.9%, a difference of 0.030%), Immigrants from Laos (91.8%, a difference of 0.030%), and Slovak (91.9%, a difference of 0.050%).
| Demographics | Rating | Rank | 1 or more Vehicles in Household |
| Iraqis | 99.8 /100 | #57 | Exceptional 91.9% |
| Immigrants | Mexico | 99.8 /100 | #58 | Exceptional 91.9% |
| Venezuelans | 99.8 /100 | #59 | Exceptional 91.9% |
| Slovaks | 99.8 /100 | #60 | Exceptional 91.9% |
| Immigrants | India | 99.8 /100 | #61 | Exceptional 91.9% |
| Thais | 99.8 /100 | #62 | Exceptional 91.9% |
| Chinese | 99.8 /100 | #63 | Exceptional 91.9% |
| Croatians | 99.8 /100 | #64 | Exceptional 91.9% |
| Immigrants | Laos | 99.8 /100 | #65 | Exceptional 91.8% |
| Canadians | 99.8 /100 | #66 | Exceptional 91.8% |
| Spaniards | 99.8 /100 | #67 | Exceptional 91.8% |
| Immigrants | Scotland | 99.7 /100 | #68 | Exceptional 91.8% |
| Palestinians | 99.7 /100 | #69 | Exceptional 91.7% |
| Lithuanians | 99.7 /100 | #70 | Exceptional 91.7% |
| Poles | 99.7 /100 | #71 | Exceptional 91.7% |
Demographics Similar to Immigrants from Asia by 1 or more Vehicles in Household
In terms of 1 or more vehicles in household, the demographic groups most similar to Immigrants from Asia are Pennsylvania German (89.3%, a difference of 0.0%), Immigrants from Sweden (89.3%, a difference of 0.020%), Crow (89.3%, a difference of 0.030%), Central American (89.2%, a difference of 0.030%), and Immigrants from Western Europe (89.2%, a difference of 0.050%).
| Demographics | Rating | Rank | 1 or more Vehicles in Household |
| Immigrants | North Macedonia | 36.5 /100 | #192 | Fair 89.5% |
| Immigrants | Northern Europe | 35.5 /100 | #193 | Fair 89.5% |
| Immigrants | Eritrea | 33.2 /100 | #194 | Fair 89.4% |
| Immigrants | Armenia | 31.8 /100 | #195 | Fair 89.4% |
| Crow | 24.3 /100 | #196 | Fair 89.3% |
| Immigrants | Sweden | 23.6 /100 | #197 | Fair 89.3% |
| Pennsylvania Germans | 22.9 /100 | #198 | Fair 89.3% |
| Immigrants | Asia | 22.8 /100 | #199 | Fair 89.3% |
| Central Americans | 21.4 /100 | #200 | Fair 89.2% |
| Immigrants | Western Europe | 20.5 /100 | #201 | Fair 89.2% |
| Iroquois | 19.8 /100 | #202 | Poor 89.2% |
| Cambodians | 18.9 /100 | #203 | Poor 89.2% |
| Romanians | 18.2 /100 | #204 | Poor 89.2% |
| Guatemalans | 17.8 /100 | #205 | Poor 89.2% |
| Apache | 16.2 /100 | #206 | Poor 89.1% |