Immigrants from Barbados vs Immigrants from Asia In Labor Force | Age 35-44
COMPARE
Immigrants from Barbados
Immigrants from Asia
In Labor Force | Age 35-44
In Labor Force | Age 35-44 Comparison
Immigrants from Barbados
Immigrants from Asia
84.1%
IN LABOR FORCE | AGE 35-44
13.2/ 100
METRIC RATING
214th/ 347
METRIC RANK
84.5%
IN LABOR FORCE | AGE 35-44
78.7/ 100
METRIC RATING
146th/ 347
METRIC RANK
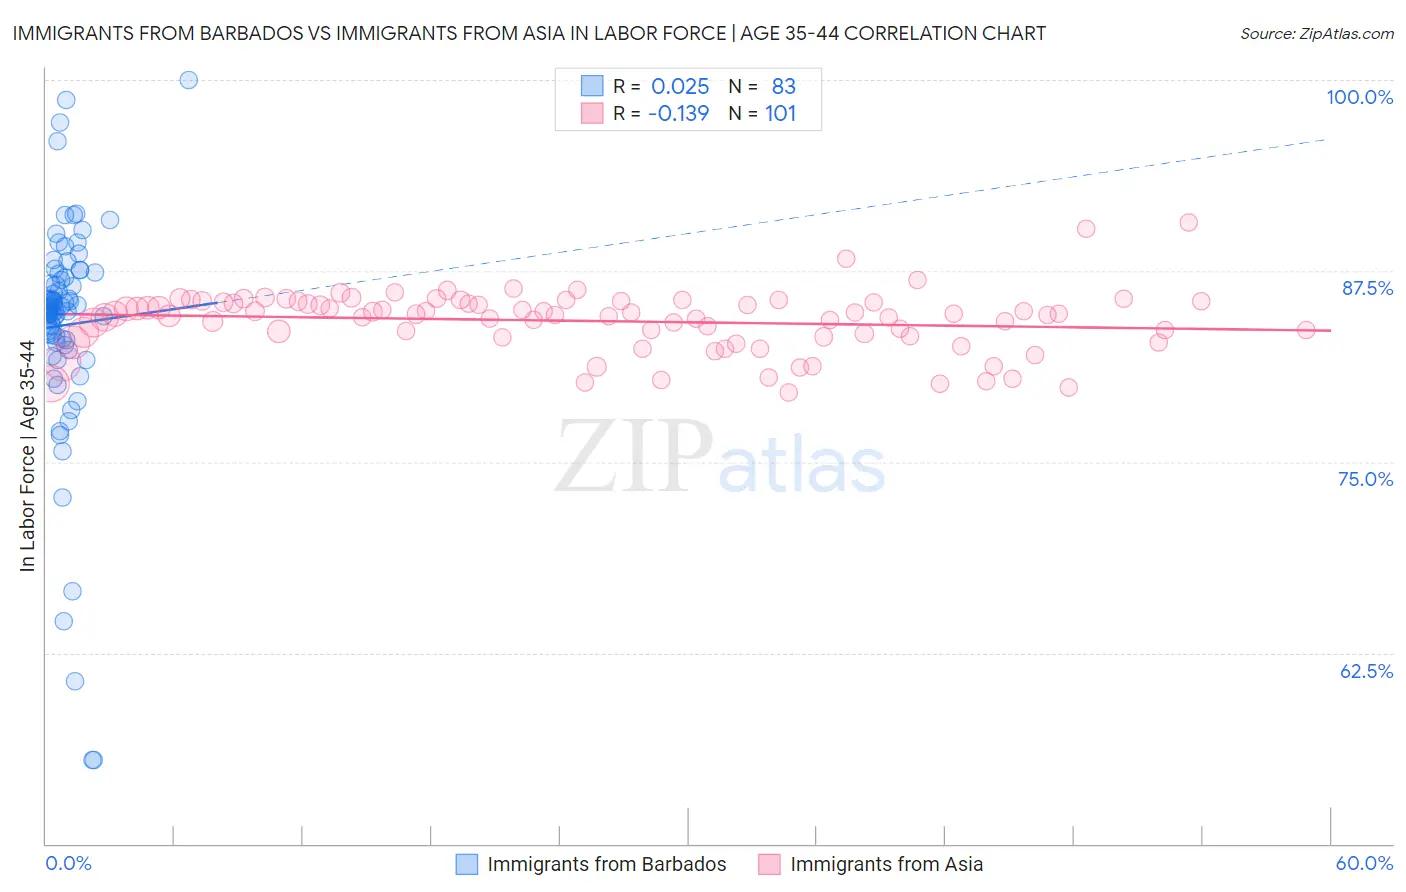
Immigrants from Barbados vs Immigrants from Asia In Labor Force | Age 35-44 Correlation Chart
The statistical analysis conducted on geographies consisting of 112,764,413 people shows no correlation between the proportion of Immigrants from Barbados and labor force participation rate among population between the ages 35 and 44 in the United States with a correlation coefficient (R) of 0.025 and weighted average of 84.1%. Similarly, the statistical analysis conducted on geographies consisting of 548,607,472 people shows a poor negative correlation between the proportion of Immigrants from Asia and labor force participation rate among population between the ages 35 and 44 in the United States with a correlation coefficient (R) of -0.139 and weighted average of 84.5%, a difference of 0.52%.
In Labor Force | Age 35-44 Correlation Summary
| Measurement | Immigrants from Barbados | Immigrants from Asia |
| Minimum | 55.5% | 79.5% |
| Maximum | 100.0% | 90.7% |
| Range | 44.5% | 11.2% |
| Mean | 84.0% | 84.2% |
| Median | 85.1% | 84.7% |
| Interquartile 25% (IQ1) | 82.8% | 83.2% |
| Interquartile 75% (IQ3) | 87.3% | 85.5% |
| Interquartile Range (IQR) | 4.5% | 2.2% |
| Standard Deviation (Sample) | 7.5% | 2.0% |
| Standard Deviation (Population) | 7.5% | 2.0% |
Similar Demographics by In Labor Force | Age 35-44
Demographics Similar to Immigrants from Barbados by In Labor Force | Age 35-44
In terms of in labor force | age 35-44, the demographic groups most similar to Immigrants from Barbados are Israeli (84.1%, a difference of 0.010%), Bangladeshi (84.1%, a difference of 0.010%), European (84.1%, a difference of 0.010%), Nicaraguan (84.1%, a difference of 0.020%), and Immigrants from Norway (84.1%, a difference of 0.020%).
| Demographics | Rating | Rank | In Labor Force | Age 35-44 |
| Laotians | 19.0 /100 | #207 | Poor 84.2% |
| Immigrants | North America | 18.1 /100 | #208 | Poor 84.2% |
| Swiss | 17.4 /100 | #209 | Poor 84.2% |
| New Zealanders | 16.2 /100 | #210 | Poor 84.1% |
| Immigrants | Ecuador | 15.2 /100 | #211 | Poor 84.1% |
| Israelis | 14.0 /100 | #212 | Poor 84.1% |
| Bangladeshis | 13.7 /100 | #213 | Poor 84.1% |
| Immigrants | Barbados | 13.2 /100 | #214 | Poor 84.1% |
| Europeans | 12.2 /100 | #215 | Poor 84.1% |
| Nicaraguans | 12.1 /100 | #216 | Poor 84.1% |
| Immigrants | Norway | 11.7 /100 | #217 | Poor 84.1% |
| Immigrants | Nicaragua | 9.4 /100 | #218 | Tragic 84.1% |
| Sub-Saharan Africans | 9.3 /100 | #219 | Tragic 84.1% |
| French | 7.5 /100 | #220 | Tragic 84.0% |
| Icelanders | 6.7 /100 | #221 | Tragic 84.0% |
Demographics Similar to Immigrants from Asia by In Labor Force | Age 35-44
In terms of in labor force | age 35-44, the demographic groups most similar to Immigrants from Asia are Immigrants from Uruguay (84.6%, a difference of 0.010%), Immigrants from Ukraine (84.6%, a difference of 0.010%), Immigrants from Jamaica (84.6%, a difference of 0.010%), Immigrants from Saudi Arabia (84.6%, a difference of 0.010%), and Immigrants from Belgium (84.6%, a difference of 0.020%).
| Demographics | Rating | Rank | In Labor Force | Age 35-44 |
| Immigrants | Zaire | 82.5 /100 | #139 | Excellent 84.6% |
| Immigrants | Japan | 81.4 /100 | #140 | Excellent 84.6% |
| Immigrants | Belgium | 80.8 /100 | #141 | Excellent 84.6% |
| Immigrants | Uruguay | 80.1 /100 | #142 | Excellent 84.6% |
| Immigrants | Ukraine | 79.7 /100 | #143 | Good 84.6% |
| Immigrants | Jamaica | 79.4 /100 | #144 | Good 84.6% |
| Immigrants | Saudi Arabia | 79.4 /100 | #145 | Good 84.6% |
| Immigrants | Asia | 78.7 /100 | #146 | Good 84.5% |
| Immigrants | Netherlands | 76.6 /100 | #147 | Good 84.5% |
| South American Indians | 73.6 /100 | #148 | Good 84.5% |
| Okinawans | 73.5 /100 | #149 | Good 84.5% |
| Immigrants | Nigeria | 73.3 /100 | #150 | Good 84.5% |
| Romanians | 72.1 /100 | #151 | Good 84.5% |
| Immigrants | Taiwan | 71.4 /100 | #152 | Good 84.5% |
| Trinidadians and Tobagonians | 69.5 /100 | #153 | Good 84.5% |