Cree vs Immigrants from Asia 1 or more Vehicles in Household
COMPARE
Cree
Immigrants from Asia
1 or more Vehicles in Household
1 or more Vehicles in Household Comparison
Cree
Immigrants from Asia
88.7%
1 OR MORE VEHICLES IN HOUSEHOLD
6.0/ 100
METRIC RATING
225th/ 347
METRIC RANK
89.3%
1 OR MORE VEHICLES IN HOUSEHOLD
22.8/ 100
METRIC RATING
199th/ 347
METRIC RANK
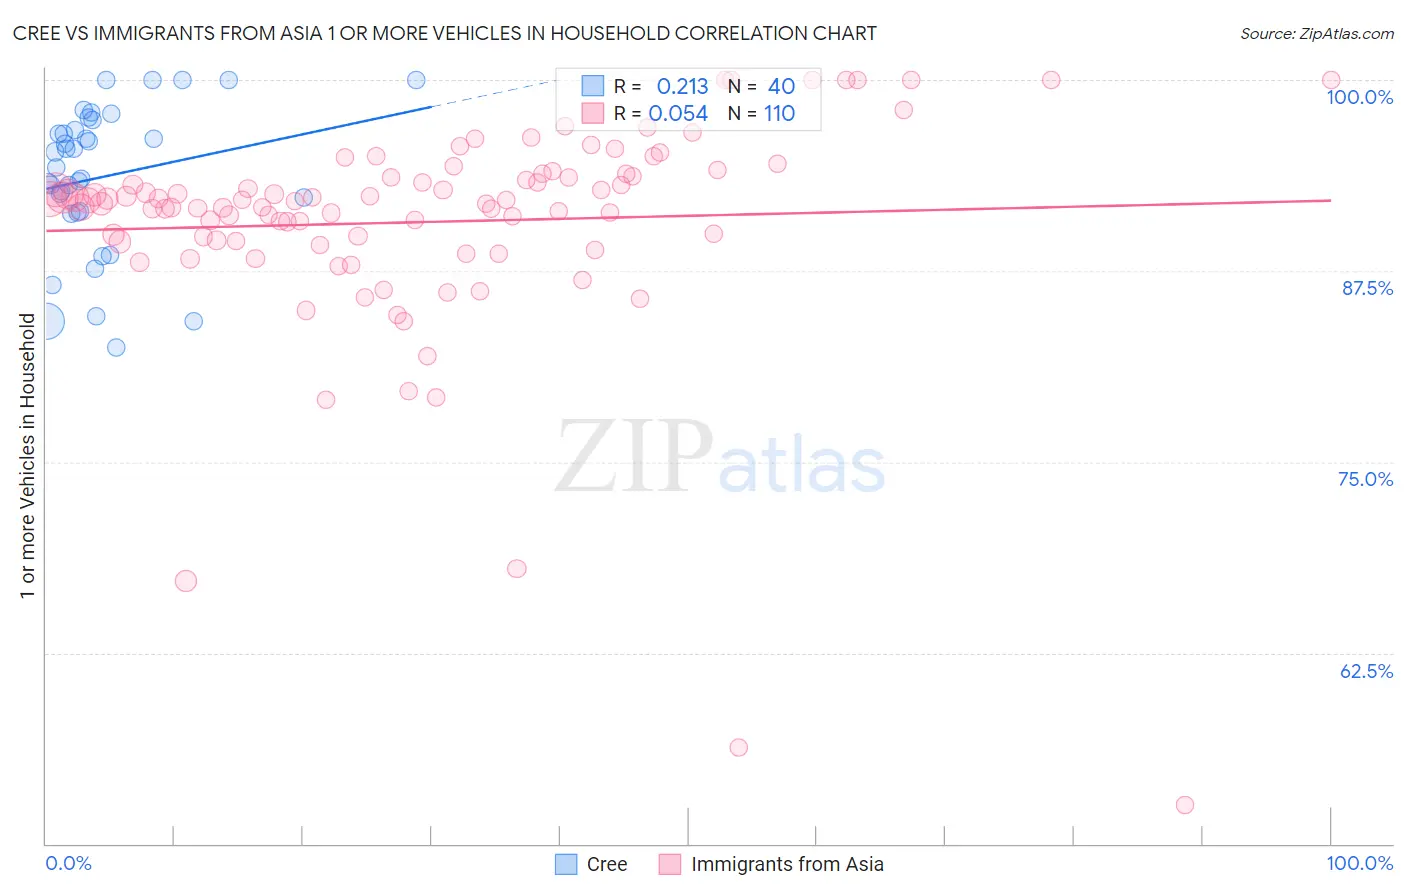
Cree vs Immigrants from Asia 1 or more Vehicles in Household Correlation Chart
The statistical analysis conducted on geographies consisting of 76,210,304 people shows a weak positive correlation between the proportion of Cree and percentage of households with 1 or more vehicles available in the United States with a correlation coefficient (R) of 0.213 and weighted average of 88.7%. Similarly, the statistical analysis conducted on geographies consisting of 548,543,467 people shows a slight positive correlation between the proportion of Immigrants from Asia and percentage of households with 1 or more vehicles available in the United States with a correlation coefficient (R) of 0.054 and weighted average of 89.3%, a difference of 0.60%.
1 or more Vehicles in Household Correlation Summary
| Measurement | Cree | Immigrants from Asia |
| Minimum | 82.5% | 52.6% |
| Maximum | 100.0% | 100.0% |
| Range | 17.5% | 47.4% |
| Mean | 93.7% | 90.7% |
| Median | 94.8% | 92.1% |
| Interquartile 25% (IQ1) | 91.4% | 89.4% |
| Interquartile 75% (IQ3) | 97.1% | 93.7% |
| Interquartile Range (IQR) | 5.7% | 4.3% |
| Standard Deviation (Sample) | 4.8% | 7.3% |
| Standard Deviation (Population) | 4.7% | 7.2% |
Similar Demographics by 1 or more Vehicles in Household
Demographics Similar to Cree by 1 or more Vehicles in Household
In terms of 1 or more vehicles in household, the demographic groups most similar to Cree are Immigrants from Hong Kong (88.7%, a difference of 0.010%), Cheyenne (88.7%, a difference of 0.030%), Ute (88.7%, a difference of 0.030%), Immigrants from Norway (88.7%, a difference of 0.040%), and Immigrants from Romania (88.7%, a difference of 0.050%).
| Demographics | Rating | Rank | 1 or more Vehicles in Household |
| Ugandans | 8.7 /100 | #218 | Tragic 88.9% |
| Immigrants | Guatemala | 8.6 /100 | #219 | Tragic 88.9% |
| Immigrants | Zaire | 8.1 /100 | #220 | Tragic 88.8% |
| Peruvians | 7.9 /100 | #221 | Tragic 88.8% |
| Uruguayans | 7.0 /100 | #222 | Tragic 88.8% |
| Immigrants | South America | 7.0 /100 | #223 | Tragic 88.8% |
| Immigrants | Hong Kong | 6.2 /100 | #224 | Tragic 88.7% |
| Cree | 6.0 /100 | #225 | Tragic 88.7% |
| Cheyenne | 5.7 /100 | #226 | Tragic 88.7% |
| Ute | 5.6 /100 | #227 | Tragic 88.7% |
| Immigrants | Norway | 5.5 /100 | #228 | Tragic 88.7% |
| Immigrants | Romania | 5.4 /100 | #229 | Tragic 88.7% |
| Immigrants | Sierra Leone | 5.2 /100 | #230 | Tragic 88.7% |
| Russians | 5.0 /100 | #231 | Tragic 88.7% |
| Immigrants | Japan | 4.9 /100 | #232 | Tragic 88.7% |
Demographics Similar to Immigrants from Asia by 1 or more Vehicles in Household
In terms of 1 or more vehicles in household, the demographic groups most similar to Immigrants from Asia are Pennsylvania German (89.3%, a difference of 0.0%), Immigrants from Sweden (89.3%, a difference of 0.020%), Crow (89.3%, a difference of 0.030%), Central American (89.2%, a difference of 0.030%), and Immigrants from Western Europe (89.2%, a difference of 0.050%).
| Demographics | Rating | Rank | 1 or more Vehicles in Household |
| Immigrants | North Macedonia | 36.5 /100 | #192 | Fair 89.5% |
| Immigrants | Northern Europe | 35.5 /100 | #193 | Fair 89.5% |
| Immigrants | Eritrea | 33.2 /100 | #194 | Fair 89.4% |
| Immigrants | Armenia | 31.8 /100 | #195 | Fair 89.4% |
| Crow | 24.3 /100 | #196 | Fair 89.3% |
| Immigrants | Sweden | 23.6 /100 | #197 | Fair 89.3% |
| Pennsylvania Germans | 22.9 /100 | #198 | Fair 89.3% |
| Immigrants | Asia | 22.8 /100 | #199 | Fair 89.3% |
| Central Americans | 21.4 /100 | #200 | Fair 89.2% |
| Immigrants | Western Europe | 20.5 /100 | #201 | Fair 89.2% |
| Iroquois | 19.8 /100 | #202 | Poor 89.2% |
| Cambodians | 18.9 /100 | #203 | Poor 89.2% |
| Romanians | 18.2 /100 | #204 | Poor 89.2% |
| Guatemalans | 17.8 /100 | #205 | Poor 89.2% |
| Apache | 16.2 /100 | #206 | Poor 89.1% |