Yakama vs Immigrants from Asia 1 or more Vehicles in Household
COMPARE
Yakama
Immigrants from Asia
1 or more Vehicles in Household
1 or more Vehicles in Household Comparison
Yakama
Immigrants from Asia
93.6%
1 OR MORE VEHICLES IN HOUSEHOLD
100.0/ 100
METRIC RATING
5th/ 347
METRIC RANK
89.3%
1 OR MORE VEHICLES IN HOUSEHOLD
22.8/ 100
METRIC RATING
199th/ 347
METRIC RANK
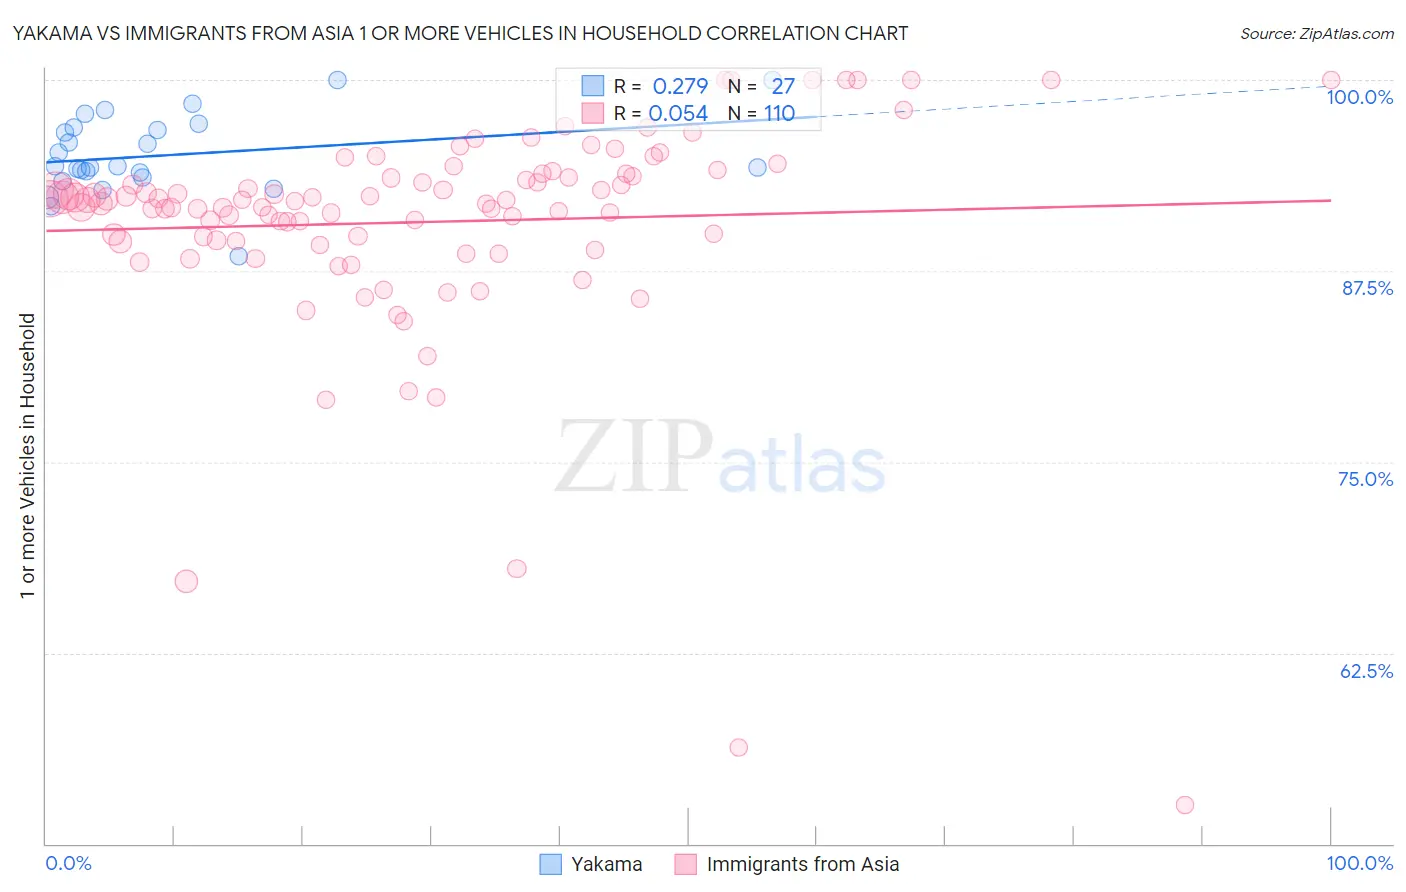
Yakama vs Immigrants from Asia 1 or more Vehicles in Household Correlation Chart
The statistical analysis conducted on geographies consisting of 19,917,879 people shows a weak positive correlation between the proportion of Yakama and percentage of households with 1 or more vehicles available in the United States with a correlation coefficient (R) of 0.279 and weighted average of 93.6%. Similarly, the statistical analysis conducted on geographies consisting of 548,543,467 people shows a slight positive correlation between the proportion of Immigrants from Asia and percentage of households with 1 or more vehicles available in the United States with a correlation coefficient (R) of 0.054 and weighted average of 89.3%, a difference of 4.8%.
1 or more Vehicles in Household Correlation Summary
| Measurement | Yakama | Immigrants from Asia |
| Minimum | 88.5% | 52.6% |
| Maximum | 100.0% | 100.0% |
| Range | 11.5% | 47.4% |
| Mean | 95.1% | 90.7% |
| Median | 94.3% | 92.1% |
| Interquartile 25% (IQ1) | 93.6% | 89.4% |
| Interquartile 75% (IQ3) | 96.9% | 93.7% |
| Interquartile Range (IQR) | 3.2% | 4.3% |
| Standard Deviation (Sample) | 2.6% | 7.3% |
| Standard Deviation (Population) | 2.5% | 7.2% |
Similar Demographics by 1 or more Vehicles in Household
Demographics Similar to Yakama by 1 or more Vehicles in Household
In terms of 1 or more vehicles in household, the demographic groups most similar to Yakama are Danish (93.5%, a difference of 0.020%), German (93.6%, a difference of 0.10%), Norwegian (93.7%, a difference of 0.14%), Scottish (93.4%, a difference of 0.21%), and Swedish (93.3%, a difference of 0.25%).
| Demographics | Rating | Rank | 1 or more Vehicles in Household |
| Luxembourgers | 100.0 /100 | #1 | Exceptional 94.8% |
| English | 100.0 /100 | #2 | Exceptional 93.8% |
| Norwegians | 100.0 /100 | #3 | Exceptional 93.7% |
| Germans | 100.0 /100 | #4 | Exceptional 93.6% |
| Yakama | 100.0 /100 | #5 | Exceptional 93.6% |
| Danes | 100.0 /100 | #6 | Exceptional 93.5% |
| Scottish | 100.0 /100 | #7 | Exceptional 93.4% |
| Swedes | 100.0 /100 | #8 | Exceptional 93.3% |
| Scotch-Irish | 100.0 /100 | #9 | Exceptional 93.3% |
| Dutch | 100.0 /100 | #10 | Exceptional 93.3% |
| Czechs | 100.0 /100 | #11 | Exceptional 93.3% |
| Scandinavians | 100.0 /100 | #12 | Exceptional 93.1% |
| Whites/Caucasians | 100.0 /100 | #13 | Exceptional 93.1% |
| Irish | 100.0 /100 | #14 | Exceptional 93.1% |
| Mexicans | 100.0 /100 | #15 | Exceptional 93.0% |
Demographics Similar to Immigrants from Asia by 1 or more Vehicles in Household
In terms of 1 or more vehicles in household, the demographic groups most similar to Immigrants from Asia are Pennsylvania German (89.3%, a difference of 0.0%), Immigrants from Sweden (89.3%, a difference of 0.020%), Crow (89.3%, a difference of 0.030%), Central American (89.2%, a difference of 0.030%), and Immigrants from Western Europe (89.2%, a difference of 0.050%).
| Demographics | Rating | Rank | 1 or more Vehicles in Household |
| Immigrants | North Macedonia | 36.5 /100 | #192 | Fair 89.5% |
| Immigrants | Northern Europe | 35.5 /100 | #193 | Fair 89.5% |
| Immigrants | Eritrea | 33.2 /100 | #194 | Fair 89.4% |
| Immigrants | Armenia | 31.8 /100 | #195 | Fair 89.4% |
| Crow | 24.3 /100 | #196 | Fair 89.3% |
| Immigrants | Sweden | 23.6 /100 | #197 | Fair 89.3% |
| Pennsylvania Germans | 22.9 /100 | #198 | Fair 89.3% |
| Immigrants | Asia | 22.8 /100 | #199 | Fair 89.3% |
| Central Americans | 21.4 /100 | #200 | Fair 89.2% |
| Immigrants | Western Europe | 20.5 /100 | #201 | Fair 89.2% |
| Iroquois | 19.8 /100 | #202 | Poor 89.2% |
| Cambodians | 18.9 /100 | #203 | Poor 89.2% |
| Romanians | 18.2 /100 | #204 | Poor 89.2% |
| Guatemalans | 17.8 /100 | #205 | Poor 89.2% |
| Apache | 16.2 /100 | #206 | Poor 89.1% |