Immigrants from Bahamas vs Tohono O'odham Professional Degree

COMPARE

Immigrants from Bahamas
Race
Ancestry
AfghanAfricanAlaska NativeAlaskan AthabascanAlbanianAleutAlsatianAmericanApacheArabArapahoArgentineanArmenianAssyrian/Chaldean/SyriacAustralianAustrianBahamianBangladeshiBarbadianBasqueBelgianBelizeanBermudanBhutaneseBlackfeetBolivianBrazilianBritishBritish West IndianBulgarianBurmeseCajunCambodianCanadianCape VerdeanCarpatho RusynCelticCentral AmericanCentral American IndianCherokeeCheyenneChickasawChileanChineseChippewaChoctawColombianColvilleComancheCosta RicanCreeCreekCroatianCrowCubanCypriotCzechCzechoslovakianDanishDelawareDominicanDutchDutch West IndianEastern EuropeanEcuadorianEgyptianEnglishEstonianEthiopianEuropeanFijianFilipinoFinnishFrenchFrench American IndianFrench CanadianGermanGerman RussianGhanaianGreekGuamanian/ChamorroGuatemalanGuyaneseHaitianHmongHonduranHopiHoumaHungarianIcelanderIndian (Asian)IndonesianInupiatIranianIraqiIrishIroquoisIsraeliItalianJamaicanJapaneseJordanianKenyanKiowaKoreanLaotianLatvianLebaneseLiberianLithuanianLumbeeLuxembourgerMacedonianMalaysianMalteseMarshalleseMenomineeMexicanMexican American IndianMongolianMoroccanNative HawaiianNavajoNepaleseNew ZealanderNicaraguanNigerianNorthern EuropeanNorwegianOkinawanOsageOttawaPaiutePakistaniPalestinianPanamanianParaguayanPennsylvania GermanPeruvianPimaPolishPortuguesePotawatomiPuebloPuerto RicanPuget Sound SalishRomanianRussianSalvadoranSamoanScandinavianScotch-IrishScottishSeminoleSenegaleseSerbianShoshoneSierra LeoneanSiouxSlavicSlovakSloveneSomaliSouth AfricanSouth AmericanSouth American IndianSoviet UnionSpaniardSpanishSpanish AmericanSpanish American IndianSri LankanSubsaharan AfricanSudaneseSwedishSwissSyrianTaiwaneseThaiTlingit-HaidaTonganTrinidadian and TobagonianTsimshianTurkishU.S. Virgin IslanderUgandanUkrainianUruguayanUteVenezuelanVietnameseWelshWest IndianYakamaYaquiYugoslavianYumanYup'ikZimbabwean
Immigration
NonimmigrantsImmigrantsAfghanistanAfricaAlbaniaArgentinaArmeniaAsiaAustraliaAustriaBahamasBangladeshBarbadosBelarusBelgiumBelizeBoliviaBosnia and HerzegovinaBrazilBulgariaBurma/MyanmarCabo VerdeCambodiaCameroonCanadaCaribbeanCentral AmericaChileChinaColombiaCongoCosta RicaCroatiaCubaCzechoslovakiaDenmarkDominicaDominican RepublicEastern AfricaEastern AsiaEastern EuropeEcuadorEgyptEl SalvadorEnglandEritreaEthiopiaEuropeFijiFranceGermanyGhanaGreeceGrenadaGuatemalaGuyanaHaitiHondurasHong KongHungaryIndiaIndonesiaIranIraqIrelandIsraelItalyJamaicaJapanJordanKazakhstanKenyaKoreaKuwaitLaosLatin AmericaLatviaLebanonLiberiaLithuaniaMalaysiaMexicoMicronesiaMiddle AfricaMoldovaMoroccoNepalNetherlandsNicaraguaNigeriaNorth AmericaNorth MacedoniaNorthern AfricaNorthern EuropeNorwayOceaniaPakistanPanamaPeruPhilippinesPolandPortugalRomaniaRussiaSaudi ArabiaScotlandSenegalSerbiaSierra LeoneSingaporeSomaliaSouth AfricaSouth AmericaSouth Central AsiaSouth Eastern AsiaSouthern EuropeSpainSri LankaSt. Vincent and the GrenadinesSudanSwedenSwitzerlandSyriaTaiwanThailandTrinidad and TobagoTurkeyUgandaUkraineUruguayUzbekistanVenezuelaVietnamWest IndiesWestern AfricaWestern AsiaWestern EuropeYemenZaireZimbabweAzores
Tohono O'odham
Race
Ancestry
AfghanAfricanAlaska NativeAlaskan AthabascanAlbanianAleutAlsatianAmericanApacheArabArapahoArgentineanArmenianAssyrian/Chaldean/SyriacAustralianAustrianBahamianBangladeshiBarbadianBasqueBelgianBelizeanBermudanBhutaneseBlackfeetBolivianBrazilianBritishBritish West IndianBulgarianBurmeseCajunCambodianCanadianCape VerdeanCarpatho RusynCelticCentral AmericanCentral American IndianCherokeeCheyenneChickasawChileanChineseChippewaChoctawColombianColvilleComancheCosta RicanCreeCreekCroatianCrowCubanCypriotCzechCzechoslovakianDanishDelawareDominicanDutchDutch West IndianEastern EuropeanEcuadorianEgyptianEnglishEstonianEthiopianEuropeanFijianFilipinoFinnishFrenchFrench American IndianFrench CanadianGermanGerman RussianGhanaianGreekGuamanian/ChamorroGuatemalanGuyaneseHaitianHmongHonduranHopiHoumaHungarianIcelanderIndian (Asian)IndonesianInupiatIranianIraqiIrishIroquoisIsraeliItalianJamaicanJapaneseJordanianKenyanKiowaKoreanLaotianLatvianLebaneseLiberianLithuanianLumbeeLuxembourgerMacedonianMalaysianMalteseMarshalleseMenomineeMexicanMexican American IndianMongolianMoroccanNative HawaiianNavajoNepaleseNew ZealanderNicaraguanNigerianNorthern EuropeanNorwegianOkinawanOsageOttawaPaiutePakistaniPalestinianPanamanianParaguayanPennsylvania GermanPeruvianPimaPolishPortuguesePotawatomiPuebloPuerto RicanPuget Sound SalishRomanianRussianSalvadoranSamoanScandinavianScotch-IrishScottishSeminoleSenegaleseSerbianShoshoneSierra LeoneanSiouxSlavicSlovakSloveneSomaliSouth AfricanSouth AmericanSouth American IndianSoviet UnionSpaniardSpanishSpanish AmericanSpanish American IndianSri LankanSubsaharan AfricanSudaneseSwedishSwissSyrianTaiwaneseThaiTlingit-HaidaTohono O'OdhamTonganTrinidadian and TobagonianTsimshianTurkishU.S. Virgin IslanderUgandanUkrainianUruguayanUteVenezuelanVietnameseWelshWest IndianYakamaYaquiYugoslavianYumanYup'ikZimbabwean
Immigration
NonimmigrantsImmigrantsAfghanistanAfricaAlbaniaArgentinaArmeniaAsiaAustraliaAustriaBangladeshBarbadosBelarusBelgiumBelizeBoliviaBosnia and HerzegovinaBrazilBulgariaBurma/MyanmarCabo VerdeCambodiaCameroonCanadaCaribbeanCentral AmericaChileChinaColombiaCongoCosta RicaCroatiaCubaCzechoslovakiaDenmarkDominicaDominican RepublicEastern AfricaEastern AsiaEastern EuropeEcuadorEgyptEl SalvadorEnglandEritreaEthiopiaEuropeFijiFranceGermanyGhanaGreeceGrenadaGuatemalaGuyanaHaitiHondurasHong KongHungaryIndiaIndonesiaIranIraqIrelandIsraelItalyJamaicaJapanJordanKazakhstanKenyaKoreaKuwaitLaosLatin AmericaLatviaLebanonLiberiaLithuaniaMalaysiaMexicoMicronesiaMiddle AfricaMoldovaMoroccoNepalNetherlandsNicaraguaNigeriaNorth AmericaNorth MacedoniaNorthern AfricaNorthern EuropeNorwayOceaniaPakistanPanamaPeruPhilippinesPolandPortugalRomaniaRussiaSaudi ArabiaScotlandSenegalSerbiaSierra LeoneSingaporeSomaliaSouth AfricaSouth AmericaSouth Central AsiaSouth Eastern AsiaSouthern EuropeSpainSri LankaSt. Vincent and the GrenadinesSudanSwedenSwitzerlandSyriaTaiwanThailandTrinidad and TobagoTurkeyUgandaUkraineUruguayUzbekistanVenezuelaVietnamWest IndiesWestern AfricaWestern AsiaWestern EuropeYemenZaireZimbabweAzores
Professional Degree
Income
Poverty
Unemployment
Labor Participation
Family Structure
Vehicle Availability
Education Level
Disability

Professional Degree Comparison

Immigrants from Bahamas

Tohono O'odham

Tragic
Tragic
3.8%
PROFESSIONAL DEGREE
2.0/ 100
METRIC RATING
244th/ 347
METRIC RANK
2.8%
PROFESSIONAL DEGREE
0.0/ 100
METRIC RATING
341st/ 347
METRIC RANK

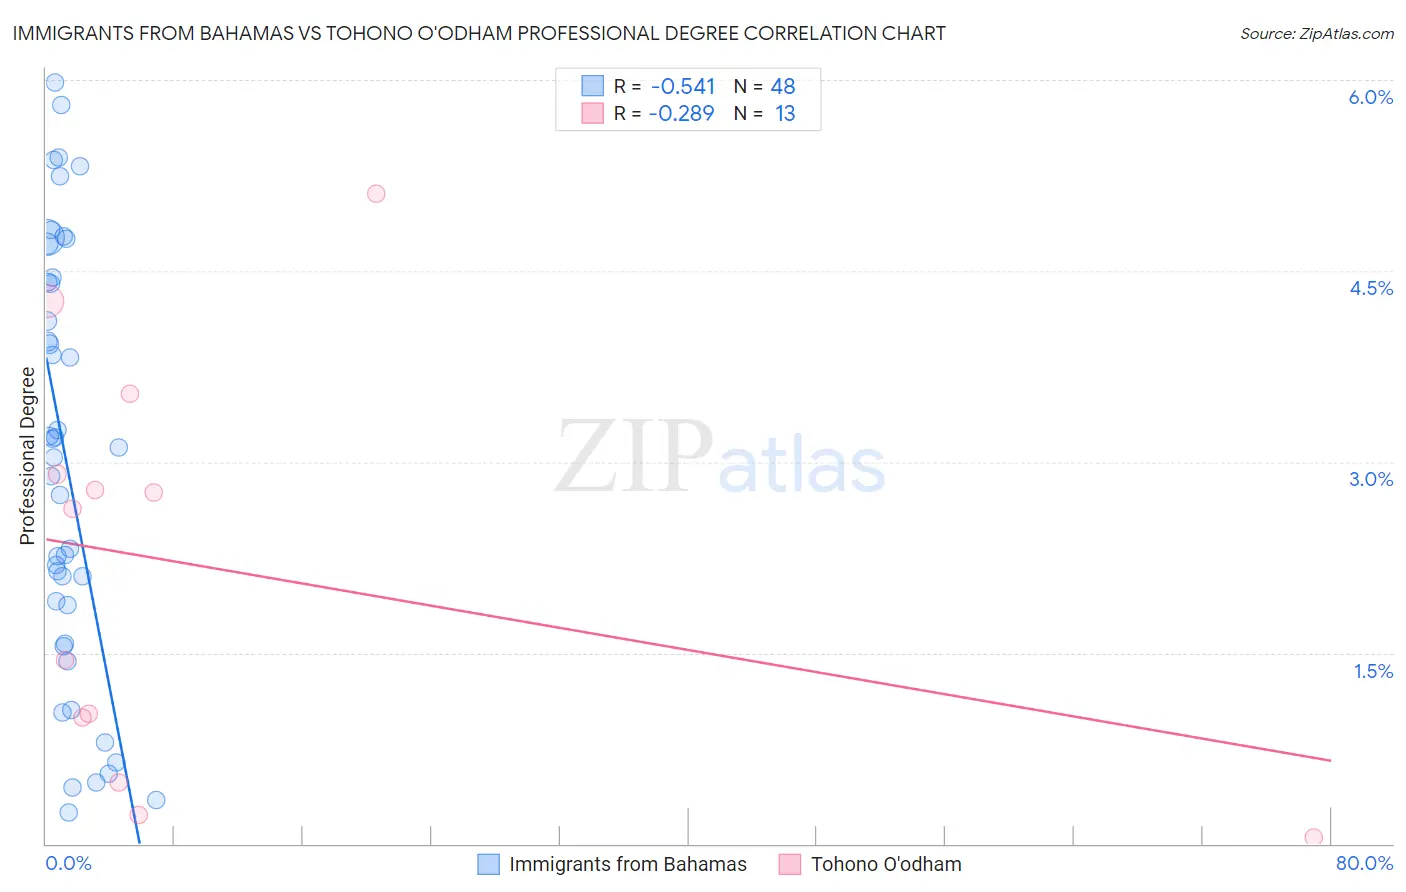
Immigrants from Bahamas vs Tohono O'odham Professional Degree Correlation Chart

The statistical analysis conducted on geographies consisting of 104,591,869 people shows a substantial negative correlation between the proportion of Immigrants from Bahamas and percentage of population with at least professional degree education in the United States with a correlation coefficient (R) of -0.541 and weighted average of 3.8%. Similarly, the statistical analysis conducted on geographies consisting of 58,607,680 people shows a weak negative correlation between the proportion of Tohono O'odham and percentage of population with at least professional degree education in the United States with a correlation coefficient (R) of -0.289 and weighted average of 2.8%, a difference of 33.0%.
Immigrants from Bahamas vs Tohono O'odham Professional Degree

Professional Degree Correlation Summary

MeasurementImmigrants from BahamasTohono O'odham
Minimum0.24%0.045%
Maximum6.0%5.1%
Range5.7%5.1%
Mean3.0%2.2%
Median3.1%2.6%
Interquartile 25% (IQ1)1.7%0.74%
Interquartile 75% (IQ3)4.4%3.2%
Interquartile Range (IQR)2.7%2.5%
Standard Deviation (Sample)1.7%1.6%
Standard Deviation (Population)1.6%1.5%

Similar Demographics by Professional Degree

Demographics Similar to Immigrants from Bahamas by Professional Degree

In terms of professional degree, the demographic groups most similar to Immigrants from Bahamas are Guamanian/Chamorro (3.8%, a difference of 0.43%), Alaskan Athabascan (3.8%, a difference of 0.51%), Native Hawaiian (3.8%, a difference of 0.51%), Immigrants from Ecuador (3.8%, a difference of 0.53%), and French American Indian (3.8%, a difference of 0.70%).
DemographicsRating | RankProfessional Degree
Immigrants | Trinidad and Tobago
3.8
/100
|
#237
Tragic
3.9%
Colville
2.6
/100
|
#238
Tragic
3.8%
British West Indians
2.4
/100
|
#239
Tragic
3.8%
Immigrants | Ecuador
2.3
/100
|
#240
Tragic
3.8%
Alaskan Athabascans
2.3
/100
|
#241
Tragic
3.8%
Native Hawaiians
2.3
/100
|
#242
Tragic
3.8%
Guamanians/Chamorros
2.2
/100
|
#243
Tragic
3.8%
Immigrants | Bahamas
2.0
/100
|
#244
Tragic
3.8%
French American Indians
1.7
/100
|
#245
Tragic
3.8%
Marshallese
1.7
/100
|
#246
Tragic
3.8%
Guyanese
1.6
/100
|
#247
Tragic
3.8%
Hmong
1.6
/100
|
#248
Tragic
3.7%
Immigrants | Grenada
1.5
/100
|
#249
Tragic
3.7%
Immigrants | Fiji
1.5
/100
|
#250
Tragic
3.7%
Immigrants | Nicaragua
1.4
/100
|
#251
Tragic
3.7%

Demographics Similar to Tohono O'odham by Professional Degree

In terms of professional degree, the demographic groups most similar to Tohono O'odham are Immigrants from the Azores (2.8%, a difference of 0.66%), Yup'ik (2.9%, a difference of 0.78%), Immigrants from Central America (2.9%, a difference of 0.83%), Navajo (2.9%, a difference of 0.95%), and Arapaho (2.9%, a difference of 1.0%).
DemographicsRating | RankProfessional Degree
Puget Sound Salish
0.0
/100
|
#333
Tragic
3.1%
Pennsylvania Germans
0.0
/100
|
#334
Tragic
3.0%
Natives/Alaskans
0.0
/100
|
#335
Tragic
3.0%
Fijians
0.0
/100
|
#336
Tragic
2.9%
Arapaho
0.0
/100
|
#337
Tragic
2.9%
Navajo
0.0
/100
|
#338
Tragic
2.9%
Immigrants | Central America
0.0
/100
|
#339
Tragic
2.9%
Yup'ik
0.0
/100
|
#340
Tragic
2.9%
Tohono O'odham
0.0
/100
|
#341
Tragic
2.8%
Immigrants | Azores
0.0
/100
|
#342
Tragic
2.8%
Mexicans
0.0
/100
|
#343
Tragic
2.7%
Spanish American Indians
0.0
/100
|
#344
Tragic
2.7%
Immigrants | Mexico
0.0
/100
|
#345
Tragic
2.6%
Lumbee
0.0
/100
|
#346
Tragic
2.5%
Houma
0.0
/100
|
#347
Tragic
2.2%