Immigrants from the Azores vs Guyanese 3 or more Vehicles in Household
COMPARE
Immigrants from the Azores
Guyanese
3 or more Vehicles in Household
3 or more Vehicles in Household Comparison
Immigrants from the Azores
Guyanese
21.5%
3 OR MORE VEHICLES IN HOUSEHOLD
99.5/ 100
METRIC RATING
87th/ 347
METRIC RANK
11.5%
3 OR MORE VEHICLES IN HOUSEHOLD
0.0/ 100
METRIC RATING
341st/ 347
METRIC RANK
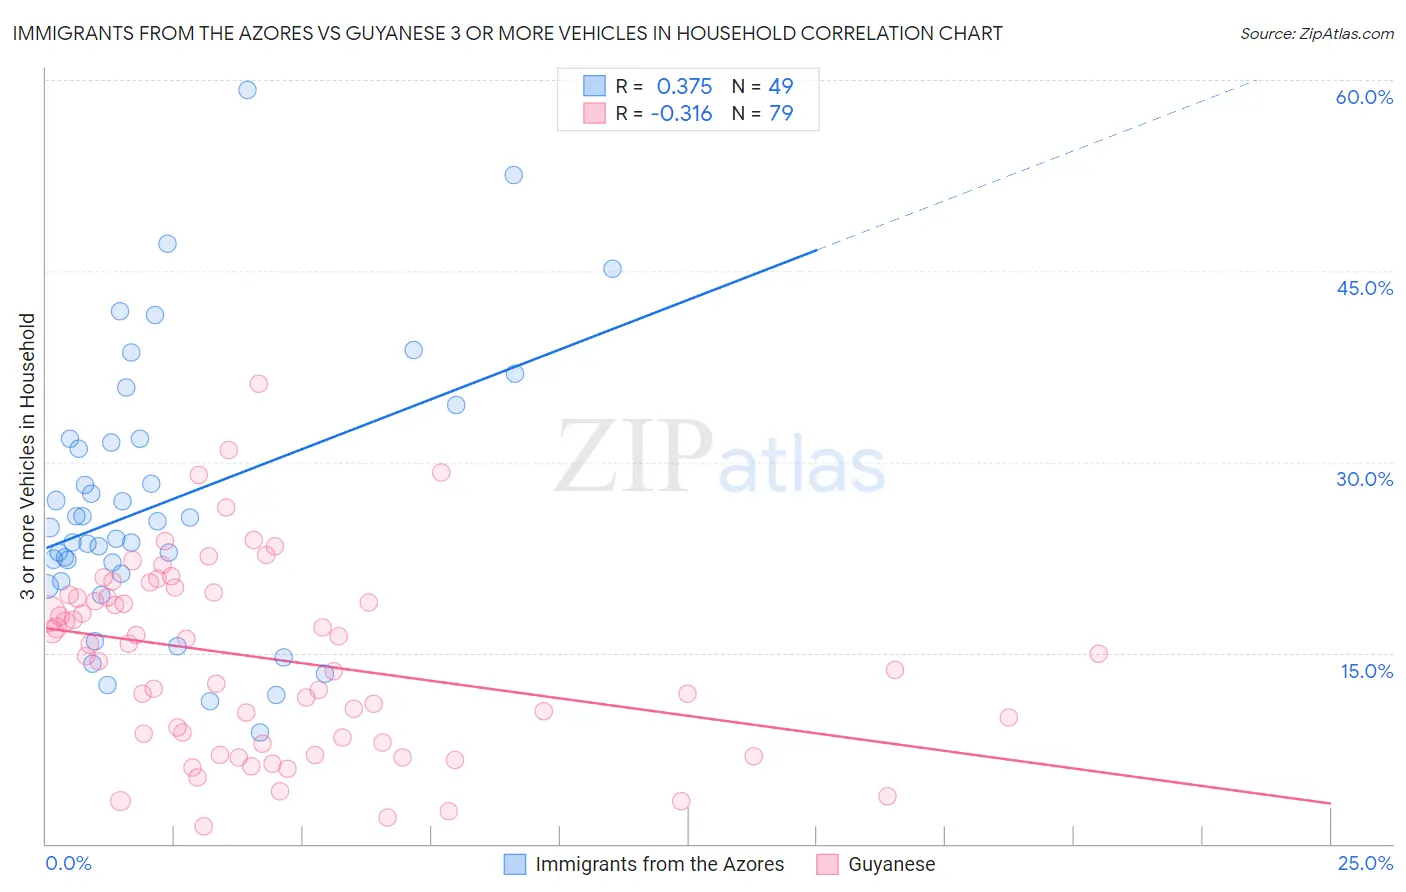
Immigrants from the Azores vs Guyanese 3 or more Vehicles in Household Correlation Chart
The statistical analysis conducted on geographies consisting of 46,257,310 people shows a mild positive correlation between the proportion of Immigrants from the Azores and percentage of households with 3 or more vehicles available in the United States with a correlation coefficient (R) of 0.375 and weighted average of 21.5%. Similarly, the statistical analysis conducted on geographies consisting of 176,755,882 people shows a mild negative correlation between the proportion of Guyanese and percentage of households with 3 or more vehicles available in the United States with a correlation coefficient (R) of -0.316 and weighted average of 11.5%, a difference of 87.5%.
3 or more Vehicles in Household Correlation Summary
| Measurement | Immigrants from the Azores | Guyanese |
| Minimum | 8.8% | 1.4% |
| Maximum | 59.2% | 36.1% |
| Range | 50.4% | 34.7% |
| Mean | 26.9% | 14.5% |
| Median | 24.9% | 15.0% |
| Interquartile 25% (IQ1) | 20.9% | 7.9% |
| Interquartile 75% (IQ3) | 31.8% | 19.5% |
| Interquartile Range (IQR) | 10.9% | 11.6% |
| Standard Deviation (Sample) | 10.8% | 7.4% |
| Standard Deviation (Population) | 10.7% | 7.4% |
Similar Demographics by 3 or more Vehicles in Household
Demographics Similar to Immigrants from the Azores by 3 or more Vehicles in Household
In terms of 3 or more vehicles in household, the demographic groups most similar to Immigrants from the Azores are Delaware (21.5%, a difference of 0.12%), Laotian (21.5%, a difference of 0.20%), Icelander (21.5%, a difference of 0.21%), Chippewa (21.5%, a difference of 0.26%), and French (21.4%, a difference of 0.26%).
| Demographics | Rating | Rank | 3 or more Vehicles in Household |
| Afghans | 99.7 /100 | #80 | Exceptional 21.7% |
| Celtics | 99.7 /100 | #81 | Exceptional 21.7% |
| Immigrants | El Salvador | 99.6 /100 | #82 | Exceptional 21.5% |
| Chippewa | 99.6 /100 | #83 | Exceptional 21.5% |
| Icelanders | 99.6 /100 | #84 | Exceptional 21.5% |
| Laotians | 99.6 /100 | #85 | Exceptional 21.5% |
| Delaware | 99.6 /100 | #86 | Exceptional 21.5% |
| Immigrants | Azores | 99.5 /100 | #87 | Exceptional 21.5% |
| French | 99.4 /100 | #88 | Exceptional 21.4% |
| Marshallese | 99.2 /100 | #89 | Exceptional 21.3% |
| Immigrants | Afghanistan | 99.1 /100 | #90 | Exceptional 21.2% |
| Belgians | 98.9 /100 | #91 | Exceptional 21.2% |
| Apache | 98.9 /100 | #92 | Exceptional 21.2% |
| Immigrants | Indonesia | 98.8 /100 | #93 | Exceptional 21.1% |
| Immigrants | Cambodia | 98.6 /100 | #94 | Exceptional 21.1% |
Demographics Similar to Guyanese by 3 or more Vehicles in Household
In terms of 3 or more vehicles in household, the demographic groups most similar to Guyanese are British West Indian (11.4%, a difference of 0.040%), Immigrants from Guyana (11.2%, a difference of 1.9%), Dominican (11.2%, a difference of 2.0%), Immigrants from Barbados (11.7%, a difference of 2.4%), and Immigrants from Uzbekistan (12.0%, a difference of 4.7%).
| Demographics | Rating | Rank | 3 or more Vehicles in Household |
| Immigrants | Cabo Verde | 0.0 /100 | #333 | Tragic 13.6% |
| Immigrants | Ecuador | 0.0 /100 | #334 | Tragic 13.4% |
| Immigrants | Trinidad and Tobago | 0.0 /100 | #335 | Tragic 13.3% |
| Barbadians | 0.0 /100 | #336 | Tragic 12.6% |
| Immigrants | Bangladesh | 0.0 /100 | #337 | Tragic 12.5% |
| Vietnamese | 0.0 /100 | #338 | Tragic 12.5% |
| Immigrants | Uzbekistan | 0.0 /100 | #339 | Tragic 12.0% |
| Immigrants | Barbados | 0.0 /100 | #340 | Tragic 11.7% |
| Guyanese | 0.0 /100 | #341 | Tragic 11.5% |
| British West Indians | 0.0 /100 | #342 | Tragic 11.4% |
| Immigrants | Guyana | 0.0 /100 | #343 | Tragic 11.2% |
| Dominicans | 0.0 /100 | #344 | Tragic 11.2% |
| Immigrants | Dominican Republic | 0.0 /100 | #345 | Tragic 10.4% |
| Immigrants | St. Vincent and the Grenadines | 0.0 /100 | #346 | Tragic 10.1% |
| Immigrants | Grenada | 0.0 /100 | #347 | Tragic 9.1% |