Immigrants from Venezuela vs Immigrants from Bolivia 3 or more Vehicles in Household
COMPARE
Immigrants from Venezuela
Immigrants from Bolivia
3 or more Vehicles in Household
3 or more Vehicles in Household Comparison
Immigrants from Venezuela
Immigrants from Bolivia
17.7%
3 OR MORE VEHICLES IN HOUSEHOLD
0.8/ 100
METRIC RATING
267th/ 347
METRIC RANK
20.4%
3 OR MORE VEHICLES IN HOUSEHOLD
92.0/ 100
METRIC RATING
127th/ 347
METRIC RANK
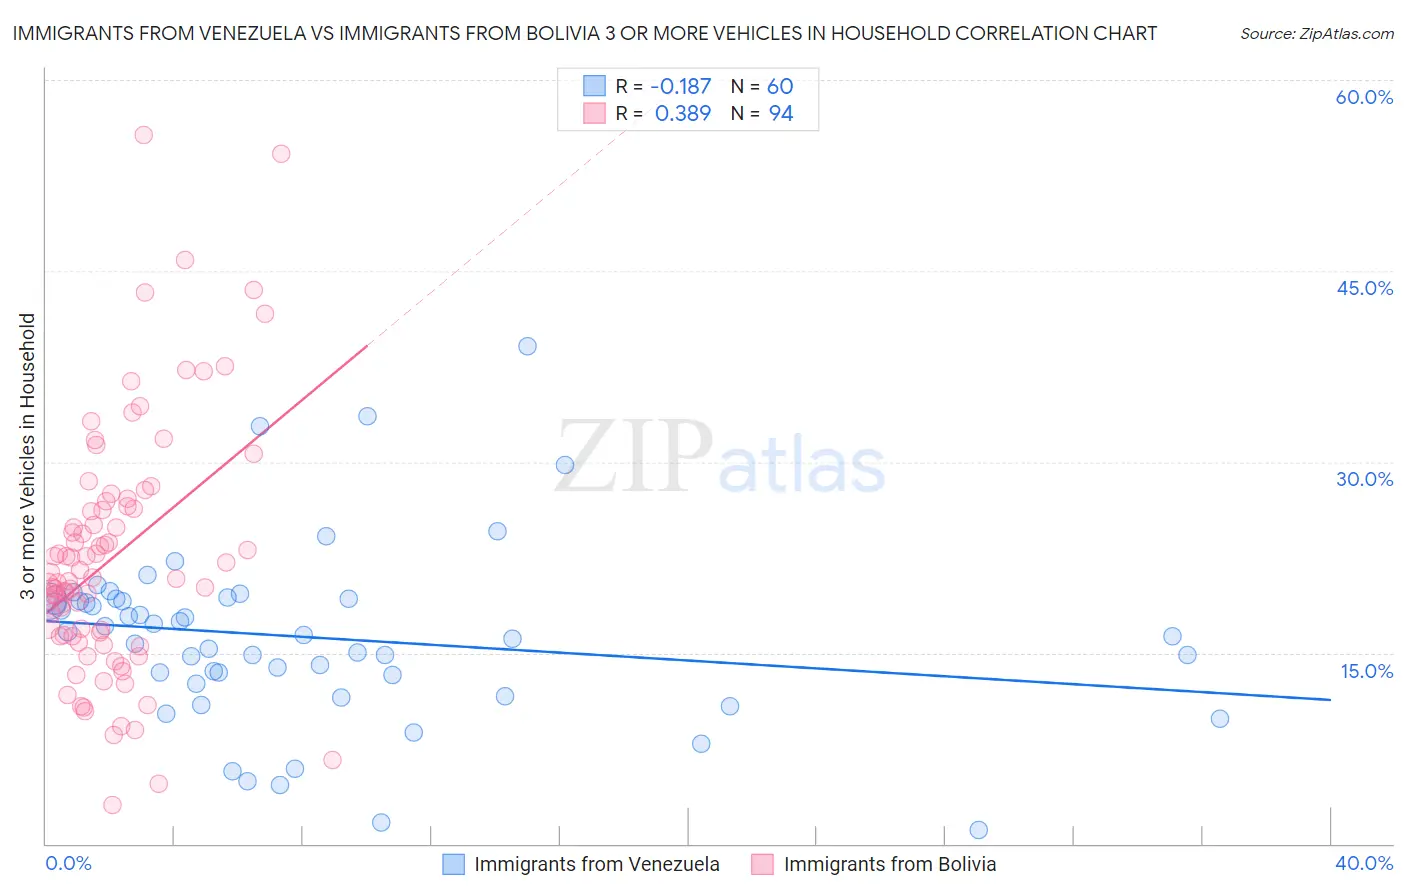
Immigrants from Venezuela vs Immigrants from Bolivia 3 or more Vehicles in Household Correlation Chart
The statistical analysis conducted on geographies consisting of 287,740,721 people shows a poor negative correlation between the proportion of Immigrants from Venezuela and percentage of households with 3 or more vehicles available in the United States with a correlation coefficient (R) of -0.187 and weighted average of 17.7%. Similarly, the statistical analysis conducted on geographies consisting of 158,700,588 people shows a mild positive correlation between the proportion of Immigrants from Bolivia and percentage of households with 3 or more vehicles available in the United States with a correlation coefficient (R) of 0.389 and weighted average of 20.4%, a difference of 15.1%.
3 or more Vehicles in Household Correlation Summary
| Measurement | Immigrants from Venezuela | Immigrants from Bolivia |
| Minimum | 1.1% | 3.1% |
| Maximum | 39.1% | 55.7% |
| Range | 38.0% | 52.6% |
| Mean | 16.2% | 22.5% |
| Median | 16.3% | 20.9% |
| Interquartile 25% (IQ1) | 12.9% | 16.3% |
| Interquartile 75% (IQ3) | 19.1% | 26.5% |
| Interquartile Range (IQR) | 6.2% | 10.2% |
| Standard Deviation (Sample) | 7.0% | 9.8% |
| Standard Deviation (Population) | 7.0% | 9.8% |
Similar Demographics by 3 or more Vehicles in Household
Demographics Similar to Immigrants from Venezuela by 3 or more Vehicles in Household
In terms of 3 or more vehicles in household, the demographic groups most similar to Immigrants from Venezuela are Immigrants from Bulgaria (17.7%, a difference of 0.010%), Macedonian (17.7%, a difference of 0.050%), Immigrants from Panama (17.7%, a difference of 0.080%), Cambodian (17.8%, a difference of 0.21%), and Bermudan (17.8%, a difference of 0.24%).
| Demographics | Rating | Rank | 3 or more Vehicles in Household |
| Ugandans | 0.9 /100 | #260 | Tragic 17.8% |
| Immigrants | Northern Africa | 0.9 /100 | #261 | Tragic 17.8% |
| Colombians | 0.9 /100 | #262 | Tragic 17.8% |
| Bermudans | 0.9 /100 | #263 | Tragic 17.8% |
| Cambodians | 0.9 /100 | #264 | Tragic 17.8% |
| Immigrants | Panama | 0.8 /100 | #265 | Tragic 17.7% |
| Macedonians | 0.8 /100 | #266 | Tragic 17.7% |
| Immigrants | Venezuela | 0.8 /100 | #267 | Tragic 17.7% |
| Immigrants | Bulgaria | 0.8 /100 | #268 | Tragic 17.7% |
| Immigrants | France | 0.6 /100 | #269 | Tragic 17.6% |
| Immigrants | Nepal | 0.6 /100 | #270 | Tragic 17.6% |
| South Americans | 0.6 /100 | #271 | Tragic 17.6% |
| Immigrants | Africa | 0.5 /100 | #272 | Tragic 17.6% |
| Immigrants | Sudan | 0.5 /100 | #273 | Tragic 17.6% |
| Immigrants | Bosnia and Herzegovina | 0.5 /100 | #274 | Tragic 17.5% |
Demographics Similar to Immigrants from Bolivia by 3 or more Vehicles in Household
In terms of 3 or more vehicles in household, the demographic groups most similar to Immigrants from Bolivia are Slavic (20.4%, a difference of 0.030%), New Zealander (20.4%, a difference of 0.17%), Immigrants from Netherlands (20.4%, a difference of 0.25%), Central American (20.5%, a difference of 0.28%), and Immigrants from Korea (20.5%, a difference of 0.45%).
| Demographics | Rating | Rank | 3 or more Vehicles in Household |
| Maltese | 93.9 /100 | #120 | Exceptional 20.5% |
| Immigrants | Thailand | 93.8 /100 | #121 | Exceptional 20.5% |
| German Russians | 93.7 /100 | #122 | Exceptional 20.5% |
| Immigrants | Korea | 93.7 /100 | #123 | Exceptional 20.5% |
| Central Americans | 93.1 /100 | #124 | Exceptional 20.5% |
| Immigrants | Netherlands | 92.9 /100 | #125 | Exceptional 20.4% |
| Slavs | 92.1 /100 | #126 | Exceptional 20.4% |
| Immigrants | Bolivia | 92.0 /100 | #127 | Exceptional 20.4% |
| New Zealanders | 91.3 /100 | #128 | Exceptional 20.4% |
| Zimbabweans | 88.7 /100 | #129 | Excellent 20.3% |
| Greeks | 88.6 /100 | #130 | Excellent 20.3% |
| Immigrants | Asia | 88.1 /100 | #131 | Excellent 20.2% |
| Immigrants | Canada | 87.8 /100 | #132 | Excellent 20.2% |
| Immigrants | North America | 87.8 /100 | #133 | Excellent 20.2% |
| Poles | 87.3 /100 | #134 | Excellent 20.2% |