Osage vs Guyanese 3 or more Vehicles in Household
COMPARE
Osage
Guyanese
3 or more Vehicles in Household
3 or more Vehicles in Household Comparison
Osage
Guyanese
22.7%
3 OR MORE VEHICLES IN HOUSEHOLD
100.0/ 100
METRIC RATING
43rd/ 347
METRIC RANK
11.5%
3 OR MORE VEHICLES IN HOUSEHOLD
0.0/ 100
METRIC RATING
341st/ 347
METRIC RANK
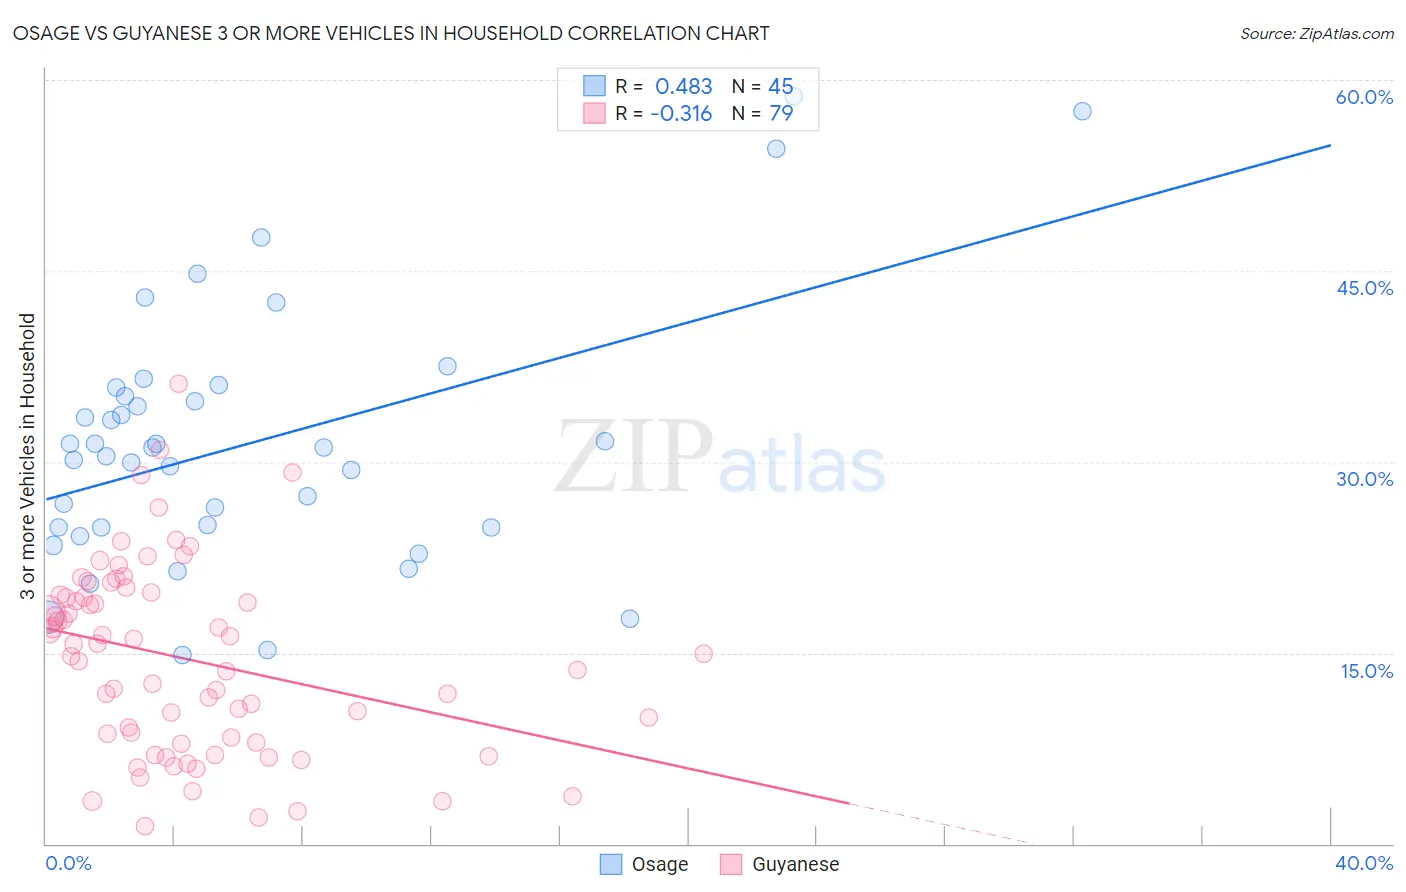
Osage vs Guyanese 3 or more Vehicles in Household Correlation Chart
The statistical analysis conducted on geographies consisting of 91,796,142 people shows a moderate positive correlation between the proportion of Osage and percentage of households with 3 or more vehicles available in the United States with a correlation coefficient (R) of 0.483 and weighted average of 22.7%. Similarly, the statistical analysis conducted on geographies consisting of 176,755,882 people shows a mild negative correlation between the proportion of Guyanese and percentage of households with 3 or more vehicles available in the United States with a correlation coefficient (R) of -0.316 and weighted average of 11.5%, a difference of 98.4%.
3 or more Vehicles in Household Correlation Summary
| Measurement | Osage | Guyanese |
| Minimum | 14.9% | 1.4% |
| Maximum | 58.7% | 36.1% |
| Range | 43.8% | 34.7% |
| Mean | 31.5% | 14.5% |
| Median | 31.1% | 15.0% |
| Interquartile 25% (IQ1) | 24.8% | 7.9% |
| Interquartile 75% (IQ3) | 35.5% | 19.5% |
| Interquartile Range (IQR) | 10.7% | 11.6% |
| Standard Deviation (Sample) | 10.1% | 7.4% |
| Standard Deviation (Population) | 10.0% | 7.4% |
Similar Demographics by 3 or more Vehicles in Household
Demographics Similar to Osage by 3 or more Vehicles in Household
In terms of 3 or more vehicles in household, the demographic groups most similar to Osage are Native/Alaskan (22.7%, a difference of 0.11%), German (22.7%, a difference of 0.12%), Cheyenne (22.7%, a difference of 0.13%), Ute (22.7%, a difference of 0.23%), and American (22.6%, a difference of 0.42%).
| Demographics | Rating | Rank | 3 or more Vehicles in Household |
| Cherokee | 100.0 /100 | #36 | Exceptional 23.0% |
| Swedes | 100.0 /100 | #37 | Exceptional 23.0% |
| Dutch | 100.0 /100 | #38 | Exceptional 22.9% |
| Yaqui | 100.0 /100 | #39 | Exceptional 22.9% |
| Europeans | 100.0 /100 | #40 | Exceptional 22.9% |
| Germans | 100.0 /100 | #41 | Exceptional 22.7% |
| Natives/Alaskans | 100.0 /100 | #42 | Exceptional 22.7% |
| Osage | 100.0 /100 | #43 | Exceptional 22.7% |
| Cheyenne | 100.0 /100 | #44 | Exceptional 22.7% |
| Ute | 100.0 /100 | #45 | Exceptional 22.7% |
| Americans | 100.0 /100 | #46 | Exceptional 22.6% |
| Malaysians | 100.0 /100 | #47 | Exceptional 22.6% |
| Scottish | 100.0 /100 | #48 | Exceptional 22.6% |
| Scotch-Irish | 100.0 /100 | #49 | Exceptional 22.6% |
| Sioux | 100.0 /100 | #50 | Exceptional 22.6% |
Demographics Similar to Guyanese by 3 or more Vehicles in Household
In terms of 3 or more vehicles in household, the demographic groups most similar to Guyanese are British West Indian (11.4%, a difference of 0.040%), Immigrants from Guyana (11.2%, a difference of 1.9%), Dominican (11.2%, a difference of 2.0%), Immigrants from Barbados (11.7%, a difference of 2.4%), and Immigrants from Uzbekistan (12.0%, a difference of 4.7%).
| Demographics | Rating | Rank | 3 or more Vehicles in Household |
| Immigrants | Cabo Verde | 0.0 /100 | #333 | Tragic 13.6% |
| Immigrants | Ecuador | 0.0 /100 | #334 | Tragic 13.4% |
| Immigrants | Trinidad and Tobago | 0.0 /100 | #335 | Tragic 13.3% |
| Barbadians | 0.0 /100 | #336 | Tragic 12.6% |
| Immigrants | Bangladesh | 0.0 /100 | #337 | Tragic 12.5% |
| Vietnamese | 0.0 /100 | #338 | Tragic 12.5% |
| Immigrants | Uzbekistan | 0.0 /100 | #339 | Tragic 12.0% |
| Immigrants | Barbados | 0.0 /100 | #340 | Tragic 11.7% |
| Guyanese | 0.0 /100 | #341 | Tragic 11.5% |
| British West Indians | 0.0 /100 | #342 | Tragic 11.4% |
| Immigrants | Guyana | 0.0 /100 | #343 | Tragic 11.2% |
| Dominicans | 0.0 /100 | #344 | Tragic 11.2% |
| Immigrants | Dominican Republic | 0.0 /100 | #345 | Tragic 10.4% |
| Immigrants | St. Vincent and the Grenadines | 0.0 /100 | #346 | Tragic 10.1% |
| Immigrants | Grenada | 0.0 /100 | #347 | Tragic 9.1% |