Immigrants from Armenia vs Spanish 2 or more Vehicles in Household
COMPARE
Immigrants from Armenia
Spanish
2 or more Vehicles in Household
2 or more Vehicles in Household Comparison
Immigrants from Armenia
Spanish
53.3%
2 OR MORE VEHICLES IN HOUSEHOLD
2.3/ 100
METRIC RATING
238th/ 347
METRIC RANK
60.2%
2 OR MORE VEHICLES IN HOUSEHOLD
100.0/ 100
METRIC RATING
34th/ 347
METRIC RANK
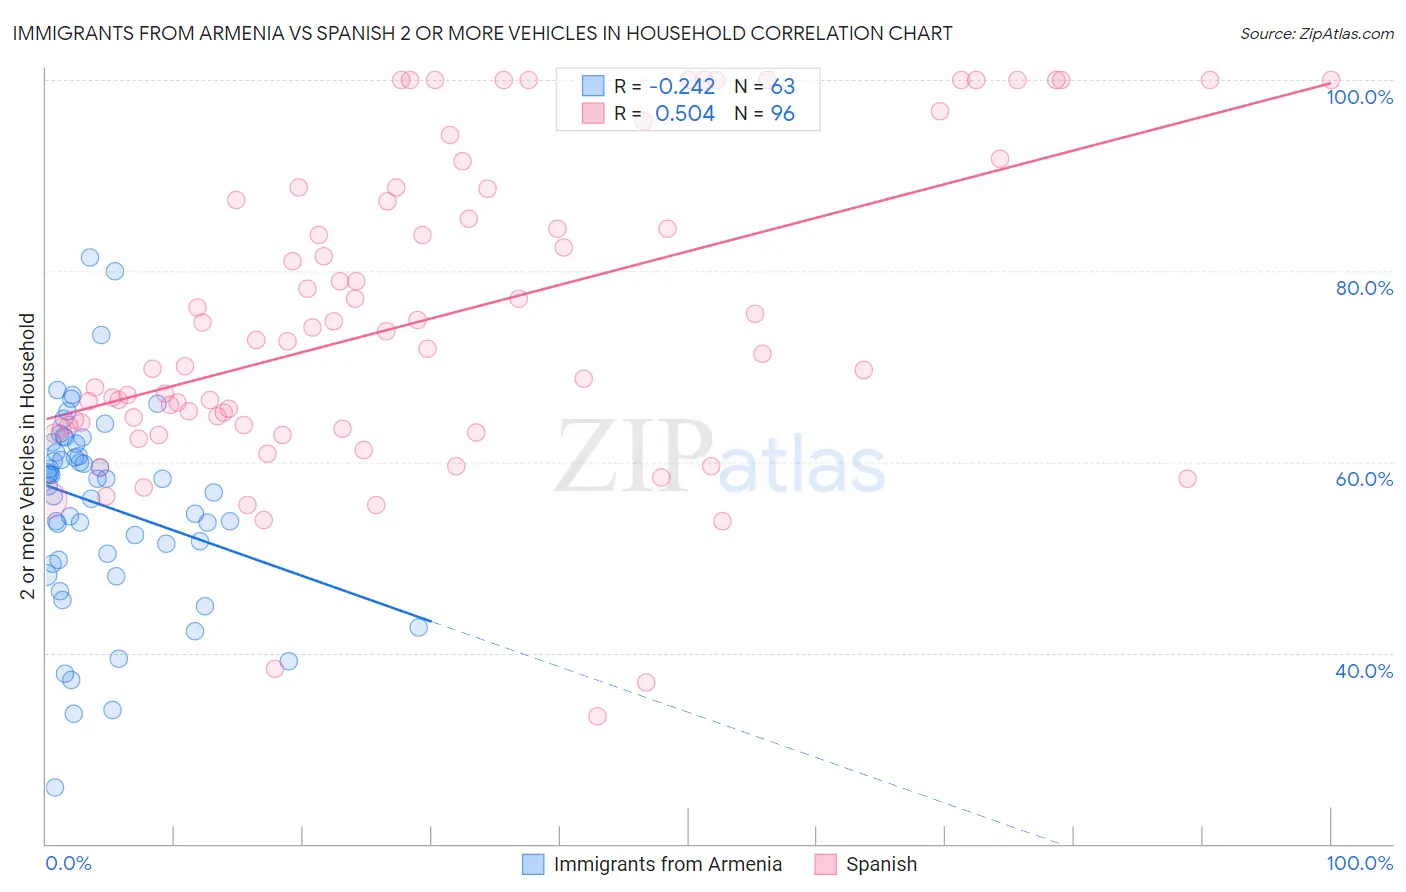
Immigrants from Armenia vs Spanish 2 or more Vehicles in Household Correlation Chart
The statistical analysis conducted on geographies consisting of 97,683,198 people shows a weak negative correlation between the proportion of Immigrants from Armenia and percentage of households with 2 or more vehicles available in the United States with a correlation coefficient (R) of -0.242 and weighted average of 53.3%. Similarly, the statistical analysis conducted on geographies consisting of 421,956,041 people shows a substantial positive correlation between the proportion of Spanish and percentage of households with 2 or more vehicles available in the United States with a correlation coefficient (R) of 0.504 and weighted average of 60.2%, a difference of 13.0%.
2 or more Vehicles in Household Correlation Summary
| Measurement | Immigrants from Armenia | Spanish |
| Minimum | 25.8% | 33.3% |
| Maximum | 81.4% | 100.0% |
| Range | 55.6% | 66.7% |
| Mean | 55.5% | 74.9% |
| Median | 58.2% | 72.2% |
| Interquartile 25% (IQ1) | 49.7% | 63.7% |
| Interquartile 75% (IQ3) | 61.9% | 88.0% |
| Interquartile Range (IQR) | 12.2% | 24.3% |
| Standard Deviation (Sample) | 10.5% | 16.2% |
| Standard Deviation (Population) | 10.4% | 16.1% |
Similar Demographics by 2 or more Vehicles in Household
Demographics Similar to Immigrants from Armenia by 2 or more Vehicles in Household
In terms of 2 or more vehicles in household, the demographic groups most similar to Immigrants from Armenia are Cambodian (53.3%, a difference of 0.010%), Macedonian (53.3%, a difference of 0.070%), Immigrants from Europe (53.2%, a difference of 0.070%), Immigrants from Sierra Leone (53.2%, a difference of 0.10%), and Immigrants from Eastern Asia (53.2%, a difference of 0.11%).
| Demographics | Rating | Rank | 2 or more Vehicles in Household |
| Panamanians | 3.4 /100 | #231 | Tragic 53.5% |
| Immigrants | Guatemala | 3.2 /100 | #232 | Tragic 53.5% |
| Ugandans | 3.2 /100 | #233 | Tragic 53.5% |
| Immigrants | Switzerland | 3.0 /100 | #234 | Tragic 53.4% |
| Immigrants | Middle Africa | 3.0 /100 | #235 | Tragic 53.4% |
| Indonesians | 2.7 /100 | #236 | Tragic 53.4% |
| Macedonians | 2.4 /100 | #237 | Tragic 53.3% |
| Immigrants | Armenia | 2.3 /100 | #238 | Tragic 53.3% |
| Cambodians | 2.3 /100 | #239 | Tragic 53.3% |
| Immigrants | Europe | 2.1 /100 | #240 | Tragic 53.2% |
| Immigrants | Sierra Leone | 2.1 /100 | #241 | Tragic 53.2% |
| Immigrants | Eastern Asia | 2.1 /100 | #242 | Tragic 53.2% |
| Ethiopians | 1.7 /100 | #243 | Tragic 53.1% |
| Indians (Asian) | 1.7 /100 | #244 | Tragic 53.1% |
| Immigrants | Ethiopia | 1.5 /100 | #245 | Tragic 53.0% |
Demographics Similar to Spanish by 2 or more Vehicles in Household
In terms of 2 or more vehicles in household, the demographic groups most similar to Spanish are Immigrants from Mexico (60.2%, a difference of 0.050%), Arapaho (60.2%, a difference of 0.11%), Immigrants from Philippines (60.1%, a difference of 0.12%), Chinese (60.1%, a difference of 0.14%), and Irish (60.1%, a difference of 0.18%).
| Demographics | Rating | Rank | 2 or more Vehicles in Household |
| Assyrians/Chaldeans/Syriacs | 100.0 /100 | #27 | Exceptional 60.5% |
| Guamanians/Chamorros | 100.0 /100 | #28 | Exceptional 60.5% |
| Hawaiians | 100.0 /100 | #29 | Exceptional 60.4% |
| Finns | 100.0 /100 | #30 | Exceptional 60.3% |
| Spanish American Indians | 100.0 /100 | #31 | Exceptional 60.3% |
| Arapaho | 100.0 /100 | #32 | Exceptional 60.2% |
| Immigrants | Mexico | 100.0 /100 | #33 | Exceptional 60.2% |
| Spanish | 100.0 /100 | #34 | Exceptional 60.2% |
| Immigrants | Philippines | 100.0 /100 | #35 | Exceptional 60.1% |
| Chinese | 100.0 /100 | #36 | Exceptional 60.1% |
| Irish | 100.0 /100 | #37 | Exceptional 60.1% |
| Americans | 100.0 /100 | #38 | Exceptional 60.0% |
| British | 100.0 /100 | #39 | Exceptional 60.0% |
| Cherokee | 100.0 /100 | #40 | Exceptional 59.9% |
| Northern Europeans | 100.0 /100 | #41 | Exceptional 59.9% |