Maltese vs Nicaraguan 2 or more Vehicles in Household
COMPARE
Maltese
Nicaraguan
2 or more Vehicles in Household
2 or more Vehicles in Household Comparison
Maltese
Nicaraguans
58.0%
2 OR MORE VEHICLES IN HOUSEHOLD
99.2/ 100
METRIC RATING
84th/ 347
METRIC RANK
56.1%
2 OR MORE VEHICLES IN HOUSEHOLD
79.9/ 100
METRIC RATING
150th/ 347
METRIC RANK
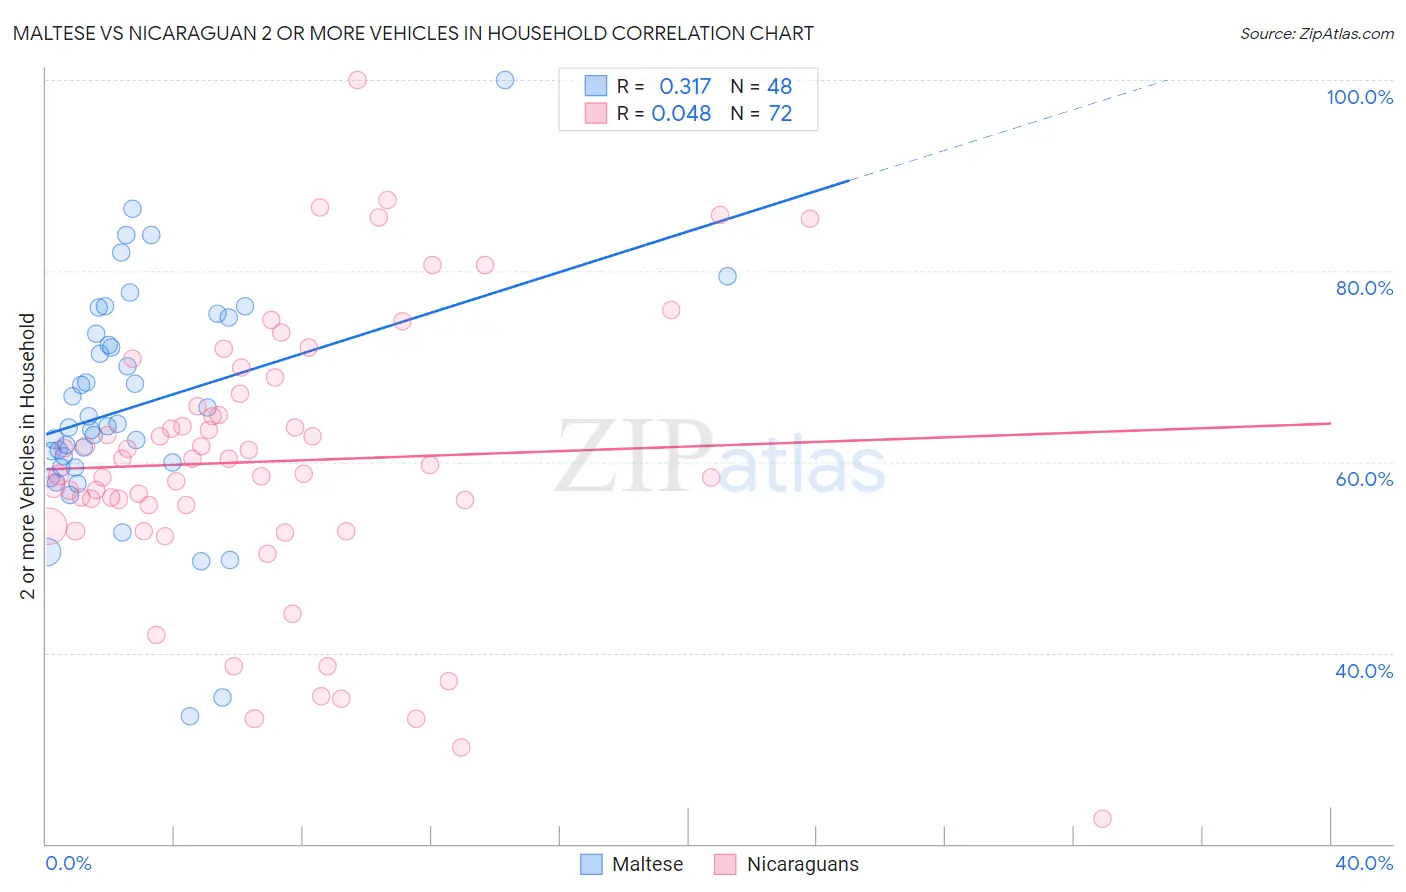
Maltese vs Nicaraguan 2 or more Vehicles in Household Correlation Chart
The statistical analysis conducted on geographies consisting of 126,441,738 people shows a mild positive correlation between the proportion of Maltese and percentage of households with 2 or more vehicles available in the United States with a correlation coefficient (R) of 0.317 and weighted average of 58.0%. Similarly, the statistical analysis conducted on geographies consisting of 285,625,326 people shows no correlation between the proportion of Nicaraguans and percentage of households with 2 or more vehicles available in the United States with a correlation coefficient (R) of 0.048 and weighted average of 56.1%, a difference of 3.4%.
2 or more Vehicles in Household Correlation Summary
| Measurement | Maltese | Nicaraguan |
| Minimum | 33.3% | 22.6% |
| Maximum | 100.0% | 100.0% |
| Range | 66.7% | 77.4% |
| Mean | 65.9% | 60.1% |
| Median | 63.9% | 60.0% |
| Interquartile 25% (IQ1) | 59.7% | 54.4% |
| Interquartile 75% (IQ3) | 74.3% | 66.5% |
| Interquartile Range (IQR) | 14.6% | 12.1% |
| Standard Deviation (Sample) | 12.2% | 14.6% |
| Standard Deviation (Population) | 12.1% | 14.5% |
Similar Demographics by 2 or more Vehicles in Household
Demographics Similar to Maltese by 2 or more Vehicles in Household
In terms of 2 or more vehicles in household, the demographic groups most similar to Maltese are Icelander (58.0%, a difference of 0.030%), Slovak (58.0%, a difference of 0.050%), Iranian (58.1%, a difference of 0.070%), Potawatomi (58.0%, a difference of 0.080%), and Thai (57.9%, a difference of 0.12%).
| Demographics | Rating | Rank | 2 or more Vehicles in Household |
| Slovenes | 99.5 /100 | #77 | Exceptional 58.3% |
| Lithuanians | 99.5 /100 | #78 | Exceptional 58.2% |
| Delaware | 99.4 /100 | #79 | Exceptional 58.2% |
| Immigrants | England | 99.3 /100 | #80 | Exceptional 58.1% |
| Immigrants | Iraq | 99.3 /100 | #81 | Exceptional 58.1% |
| Iranians | 99.3 /100 | #82 | Exceptional 58.1% |
| Icelanders | 99.2 /100 | #83 | Exceptional 58.0% |
| Maltese | 99.2 /100 | #84 | Exceptional 58.0% |
| Slovaks | 99.2 /100 | #85 | Exceptional 58.0% |
| Potawatomi | 99.1 /100 | #86 | Exceptional 58.0% |
| Thais | 99.1 /100 | #87 | Exceptional 57.9% |
| Immigrants | Iran | 99.1 /100 | #88 | Exceptional 57.9% |
| Immigrants | Germany | 99.0 /100 | #89 | Exceptional 57.9% |
| Hispanics or Latinos | 99.0 /100 | #90 | Exceptional 57.9% |
| Pakistanis | 99.0 /100 | #91 | Exceptional 57.9% |
Demographics Similar to Nicaraguans by 2 or more Vehicles in Household
In terms of 2 or more vehicles in household, the demographic groups most similar to Nicaraguans are Immigrants from Moldova (56.1%, a difference of 0.020%), Chilean (56.1%, a difference of 0.020%), Serbian (56.1%, a difference of 0.030%), Venezuelan (56.1%, a difference of 0.050%), and Immigrants from Northern Europe (56.1%, a difference of 0.070%).
| Demographics | Rating | Rank | 2 or more Vehicles in Household |
| Seminole | 81.7 /100 | #143 | Excellent 56.2% |
| Immigrants | Syria | 81.4 /100 | #144 | Excellent 56.2% |
| Syrians | 81.2 /100 | #145 | Excellent 56.2% |
| Venezuelans | 80.7 /100 | #146 | Excellent 56.1% |
| Serbians | 80.3 /100 | #147 | Excellent 56.1% |
| Immigrants | Moldova | 80.2 /100 | #148 | Excellent 56.1% |
| Chileans | 80.2 /100 | #149 | Excellent 56.1% |
| Nicaraguans | 79.9 /100 | #150 | Good 56.1% |
| Immigrants | Northern Europe | 78.7 /100 | #151 | Good 56.1% |
| Immigrants | Pakistan | 78.1 /100 | #152 | Good 56.1% |
| Lumbee | 71.9 /100 | #153 | Good 55.9% |
| Ukrainians | 70.8 /100 | #154 | Good 55.8% |
| Immigrants | Venezuela | 70.7 /100 | #155 | Good 55.8% |
| Immigrants | Lithuania | 70.4 /100 | #156 | Good 55.8% |
| Immigrants | Kuwait | 70.2 /100 | #157 | Good 55.8% |