Immigrants from Albania vs Immigrants from Greece Male Unemployment
COMPARE
Immigrants from Albania
Immigrants from Greece
Male Unemployment
Male Unemployment Comparison
Immigrants from Albania
Immigrants from Greece
5.5%
MALE UNEMPLOYMENT
3.6/ 100
METRIC RATING
218th/ 347
METRIC RANK
5.4%
MALE UNEMPLOYMENT
14.5/ 100
METRIC RATING
199th/ 347
METRIC RANK
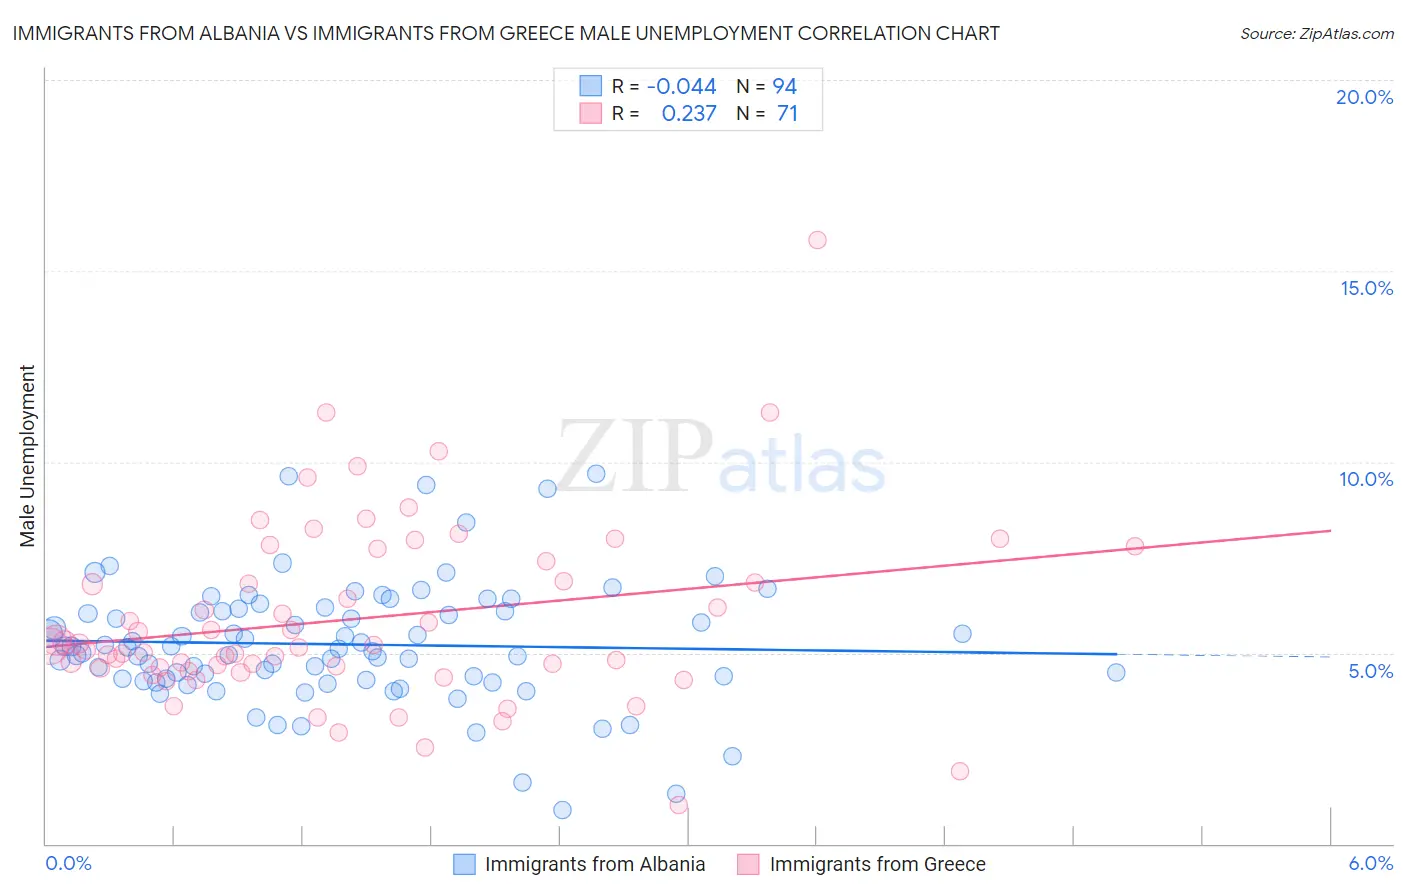
Immigrants from Albania vs Immigrants from Greece Male Unemployment Correlation Chart
The statistical analysis conducted on geographies consisting of 119,319,366 people shows no correlation between the proportion of Immigrants from Albania and unemployment rate among males in the United States with a correlation coefficient (R) of -0.044 and weighted average of 5.5%. Similarly, the statistical analysis conducted on geographies consisting of 216,564,695 people shows a weak positive correlation between the proportion of Immigrants from Greece and unemployment rate among males in the United States with a correlation coefficient (R) of 0.237 and weighted average of 5.4%, a difference of 2.1%.
Male Unemployment Correlation Summary
| Measurement | Immigrants from Albania | Immigrants from Greece |
| Minimum | 0.90% | 1.0% |
| Maximum | 9.7% | 15.8% |
| Range | 8.8% | 14.8% |
| Mean | 5.2% | 5.9% |
| Median | 5.1% | 5.2% |
| Interquartile 25% (IQ1) | 4.3% | 4.6% |
| Interquartile 75% (IQ3) | 6.1% | 7.4% |
| Interquartile Range (IQR) | 1.8% | 2.8% |
| Standard Deviation (Sample) | 1.6% | 2.4% |
| Standard Deviation (Population) | 1.6% | 2.4% |
Demographics Similar to Immigrants from Albania and Immigrants from Greece by Male Unemployment
In terms of male unemployment, the demographic groups most similar to Immigrants from Albania are Delaware (5.5%, a difference of 0.21%), Immigrants (5.5%, a difference of 0.26%), Samoan (5.5%, a difference of 0.43%), Puget Sound Salish (5.5%, a difference of 0.63%), and Ugandan (5.5%, a difference of 0.80%). Similarly, the demographic groups most similar to Immigrants from Greece are Immigrants from Thailand (5.4%, a difference of 0.020%), Immigrants from Zaire (5.4%, a difference of 0.10%), Immigrants from Philippines (5.4%, a difference of 0.12%), Nonimmigrants (5.4%, a difference of 0.16%), and Immigrants from Laos (5.4%, a difference of 0.18%).
| Demographics | Rating | Rank | Male Unemployment |
| Immigrants | Thailand | 14.7 /100 | #198 | Poor 5.4% |
| Immigrants | Greece | 14.5 /100 | #199 | Poor 5.4% |
| Immigrants | Zaire | 13.7 /100 | #200 | Poor 5.4% |
| Immigrants | Philippines | 13.5 /100 | #201 | Poor 5.4% |
| Immigrants | Nonimmigrants | 13.1 /100 | #202 | Poor 5.4% |
| Immigrants | Laos | 13.0 /100 | #203 | Poor 5.4% |
| Guamanians/Chamorros | 12.3 /100 | #204 | Poor 5.4% |
| Immigrants | Costa Rica | 11.4 /100 | #205 | Poor 5.5% |
| Immigrants | Ukraine | 9.9 /100 | #206 | Tragic 5.5% |
| Immigrants | Syria | 9.3 /100 | #207 | Tragic 5.5% |
| Immigrants | Lebanon | 8.6 /100 | #208 | Tragic 5.5% |
| Immigrants | Middle Africa | 8.3 /100 | #209 | Tragic 5.5% |
| South American Indians | 7.6 /100 | #210 | Tragic 5.5% |
| Israelis | 7.4 /100 | #211 | Tragic 5.5% |
| Hmong | 7.0 /100 | #212 | Tragic 5.5% |
| Ugandans | 6.3 /100 | #213 | Tragic 5.5% |
| Puget Sound Salish | 5.6 /100 | #214 | Tragic 5.5% |
| Samoans | 4.9 /100 | #215 | Tragic 5.5% |
| Immigrants | Immigrants | 4.3 /100 | #216 | Tragic 5.5% |
| Delaware | 4.2 /100 | #217 | Tragic 5.5% |
| Immigrants | Albania | 3.6 /100 | #218 | Tragic 5.5% |