Hungarian vs Immigrants from Panama Female Unemployment
COMPARE
Hungarian
Immigrants from Panama
Female Unemployment
Female Unemployment Comparison
Hungarians
Immigrants from Panama
4.9%
FEMALE UNEMPLOYMENT
98.3/ 100
METRIC RATING
66th/ 347
METRIC RANK
5.5%
FEMALE UNEMPLOYMENT
3.2/ 100
METRIC RATING
237th/ 347
METRIC RANK
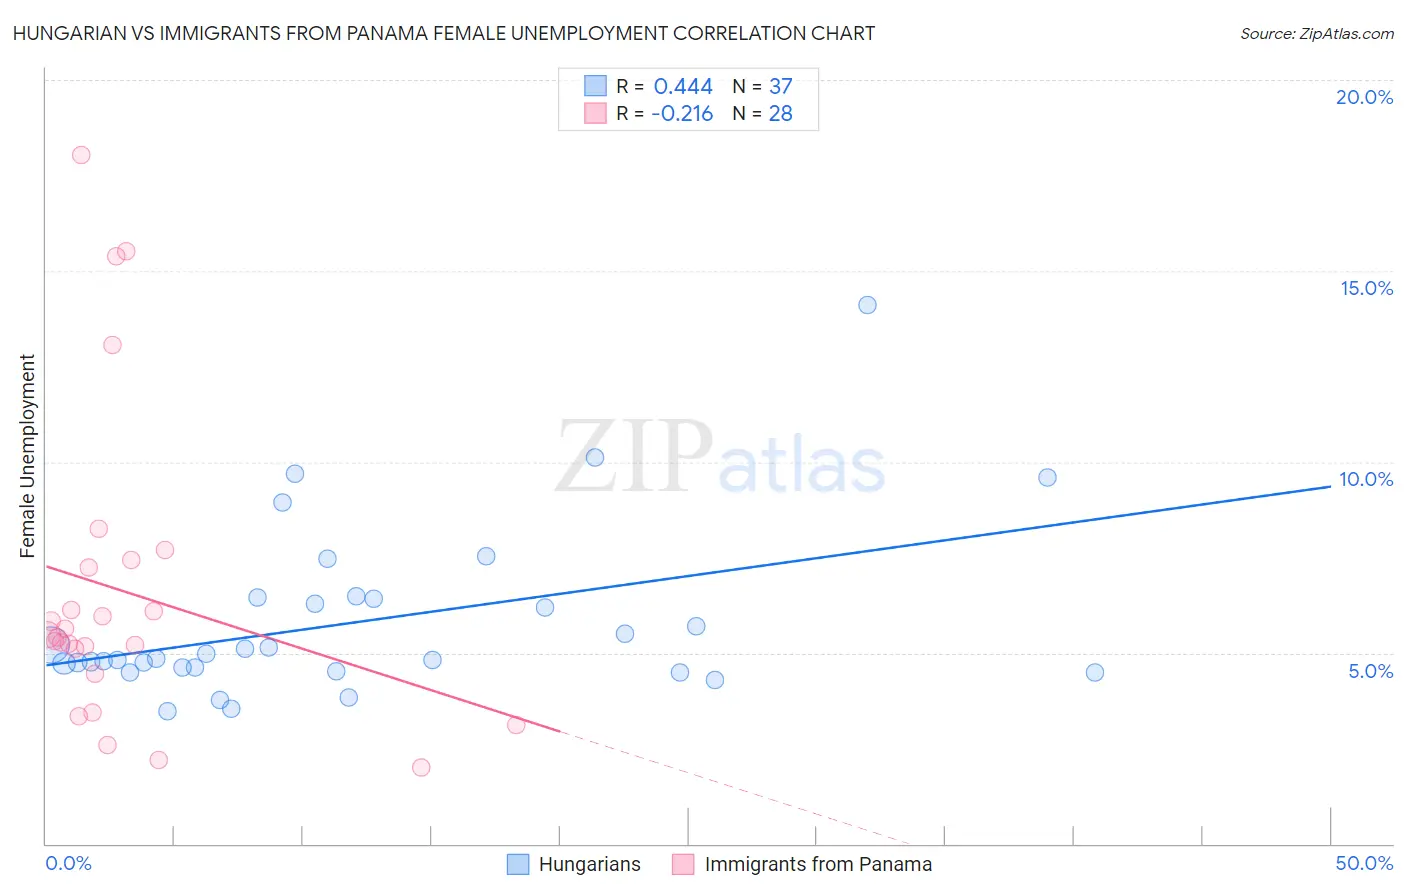
Hungarian vs Immigrants from Panama Female Unemployment Correlation Chart
The statistical analysis conducted on geographies consisting of 480,650,444 people shows a moderate positive correlation between the proportion of Hungarians and unemploymnet rate among females in the United States with a correlation coefficient (R) of 0.444 and weighted average of 4.9%. Similarly, the statistical analysis conducted on geographies consisting of 220,928,919 people shows a weak negative correlation between the proportion of Immigrants from Panama and unemploymnet rate among females in the United States with a correlation coefficient (R) of -0.216 and weighted average of 5.5%, a difference of 11.9%.
Female Unemployment Correlation Summary
| Measurement | Hungarian | Immigrants from Panama |
| Minimum | 3.5% | 2.0% |
| Maximum | 14.1% | 18.0% |
| Range | 10.6% | 16.0% |
| Mean | 5.8% | 6.6% |
| Median | 4.8% | 5.4% |
| Interquartile 25% (IQ1) | 4.6% | 4.8% |
| Interquartile 75% (IQ3) | 6.4% | 7.3% |
| Interquartile Range (IQR) | 1.9% | 2.6% |
| Standard Deviation (Sample) | 2.2% | 4.1% |
| Standard Deviation (Population) | 2.2% | 4.0% |
Similar Demographics by Female Unemployment
Demographics Similar to Hungarians by Female Unemployment
In terms of female unemployment, the demographic groups most similar to Hungarians are Cuban (4.9%, a difference of 0.0%), Tlingit-Haida (4.9%, a difference of 0.010%), Immigrants from Ireland (4.9%, a difference of 0.020%), Immigrants from North America (4.9%, a difference of 0.030%), and Osage (4.9%, a difference of 0.060%).
| Demographics | Rating | Rank | Female Unemployment |
| Bhutanese | 98.7 /100 | #59 | Exceptional 4.9% |
| Immigrants | Scotland | 98.6 /100 | #60 | Exceptional 4.9% |
| Immigrants | Canada | 98.6 /100 | #61 | Exceptional 4.9% |
| Immigrants | Nepal | 98.6 /100 | #62 | Exceptional 4.9% |
| Immigrants | Belgium | 98.5 /100 | #63 | Exceptional 4.9% |
| Celtics | 98.5 /100 | #64 | Exceptional 4.9% |
| Immigrants | North America | 98.3 /100 | #65 | Exceptional 4.9% |
| Hungarians | 98.3 /100 | #66 | Exceptional 4.9% |
| Cubans | 98.3 /100 | #67 | Exceptional 4.9% |
| Tlingit-Haida | 98.3 /100 | #68 | Exceptional 4.9% |
| Immigrants | Ireland | 98.2 /100 | #69 | Exceptional 4.9% |
| Osage | 98.2 /100 | #70 | Exceptional 4.9% |
| German Russians | 98.1 /100 | #71 | Exceptional 4.9% |
| Immigrants | Northern Europe | 98.0 /100 | #72 | Exceptional 4.9% |
| Russians | 98.0 /100 | #73 | Exceptional 5.0% |
Demographics Similar to Immigrants from Panama by Female Unemployment
In terms of female unemployment, the demographic groups most similar to Immigrants from Panama are Immigrants from Cambodia (5.5%, a difference of 0.020%), Sierra Leonean (5.5%, a difference of 0.020%), Immigrants from Lebanon (5.5%, a difference of 0.060%), Immigrants from Iran (5.5%, a difference of 0.060%), and Moroccan (5.5%, a difference of 0.080%).
| Demographics | Rating | Rank | Female Unemployment |
| Immigrants | Uruguay | 4.7 /100 | #230 | Tragic 5.5% |
| Immigrants | Iraq | 3.9 /100 | #231 | Tragic 5.5% |
| Liberians | 3.9 /100 | #232 | Tragic 5.5% |
| Moroccans | 3.4 /100 | #233 | Tragic 5.5% |
| Immigrants | Lebanon | 3.3 /100 | #234 | Tragic 5.5% |
| Immigrants | Iran | 3.3 /100 | #235 | Tragic 5.5% |
| Immigrants | Cambodia | 3.3 /100 | #236 | Tragic 5.5% |
| Immigrants | Panama | 3.2 /100 | #237 | Tragic 5.5% |
| Sierra Leoneans | 3.2 /100 | #238 | Tragic 5.5% |
| Aleuts | 3.0 /100 | #239 | Tragic 5.5% |
| Immigrants | South America | 2.9 /100 | #240 | Tragic 5.5% |
| South American Indians | 2.8 /100 | #241 | Tragic 5.5% |
| Marshallese | 2.3 /100 | #242 | Tragic 5.6% |
| Spanish Americans | 2.2 /100 | #243 | Tragic 5.6% |
| Immigrants | Liberia | 1.5 /100 | #244 | Tragic 5.6% |