Immigrants from England vs Immigrants from Bulgaria 2 or more Vehicles in Household
COMPARE
Immigrants from England
Immigrants from Bulgaria
2 or more Vehicles in Household
2 or more Vehicles in Household Comparison
Immigrants from England
Immigrants from Bulgaria
58.1%
2 OR MORE VEHICLES IN HOUSEHOLD
99.3/ 100
METRIC RATING
80th/ 347
METRIC RANK
54.3%
2 OR MORE VEHICLES IN HOUSEHOLD
12.0/ 100
METRIC RATING
209th/ 347
METRIC RANK
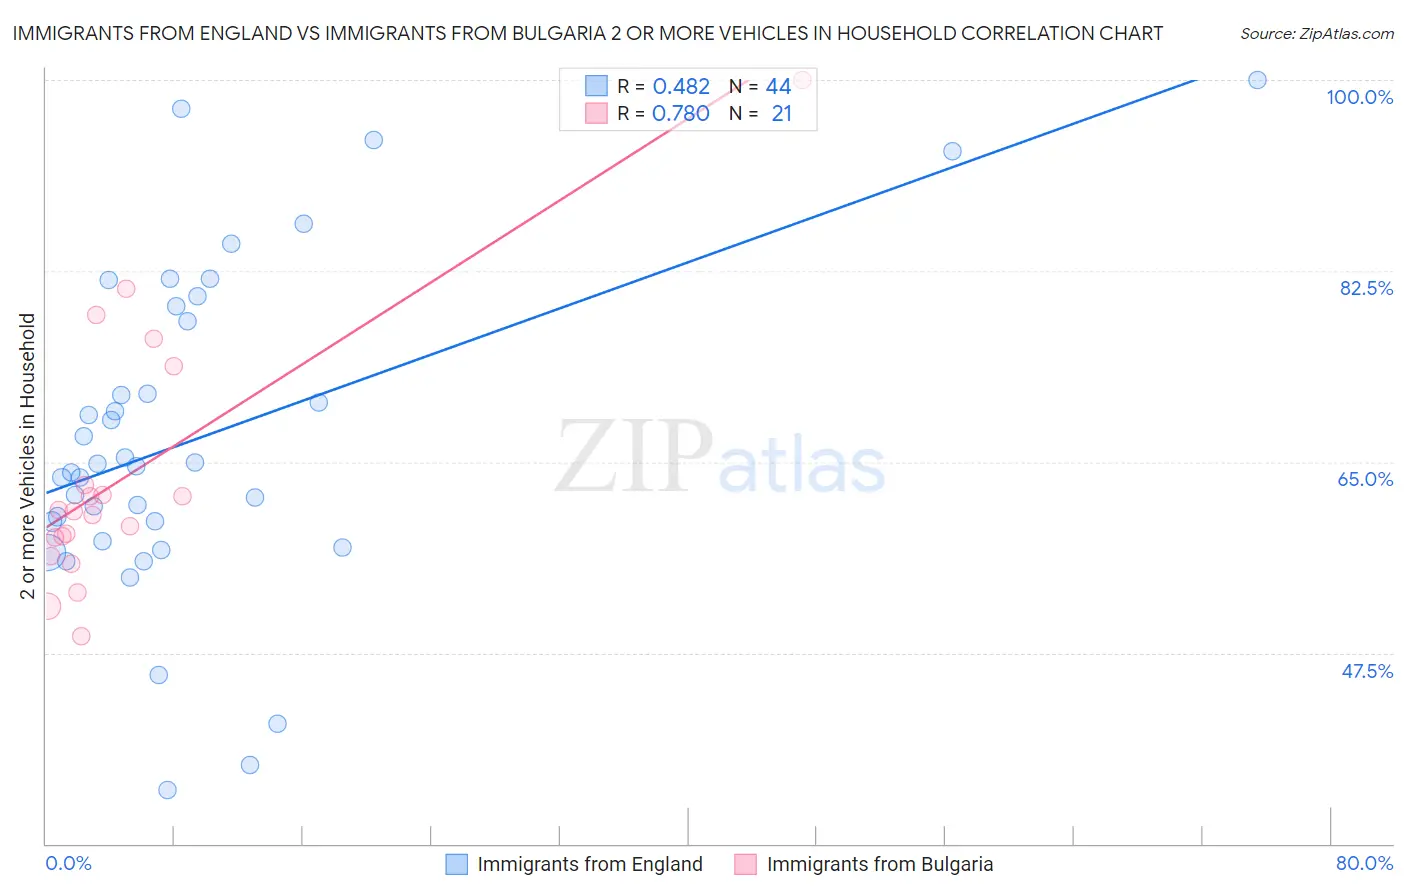
Immigrants from England vs Immigrants from Bulgaria 2 or more Vehicles in Household Correlation Chart
The statistical analysis conducted on geographies consisting of 391,775,119 people shows a moderate positive correlation between the proportion of Immigrants from England and percentage of households with 2 or more vehicles available in the United States with a correlation coefficient (R) of 0.482 and weighted average of 58.1%. Similarly, the statistical analysis conducted on geographies consisting of 172,541,029 people shows a strong positive correlation between the proportion of Immigrants from Bulgaria and percentage of households with 2 or more vehicles available in the United States with a correlation coefficient (R) of 0.780 and weighted average of 54.3%, a difference of 7.1%.
2 or more Vehicles in Household Correlation Summary
| Measurement | Immigrants from England | Immigrants from Bulgaria |
| Minimum | 34.9% | 49.0% |
| Maximum | 100.0% | 100.0% |
| Range | 65.1% | 51.0% |
| Mean | 67.2% | 63.7% |
| Median | 64.7% | 60.5% |
| Interquartile 25% (IQ1) | 58.6% | 57.2% |
| Interquartile 75% (IQ3) | 78.6% | 68.3% |
| Interquartile Range (IQR) | 19.9% | 11.1% |
| Standard Deviation (Sample) | 14.9% | 11.9% |
| Standard Deviation (Population) | 14.7% | 11.6% |
Similar Demographics by 2 or more Vehicles in Household
Demographics Similar to Immigrants from England by 2 or more Vehicles in Household
In terms of 2 or more vehicles in household, the demographic groups most similar to Immigrants from England are Immigrants from Iraq (58.1%, a difference of 0.010%), Iranian (58.1%, a difference of 0.10%), Delaware (58.2%, a difference of 0.14%), Icelander (58.0%, a difference of 0.14%), and Maltese (58.0%, a difference of 0.17%).
| Demographics | Rating | Rank | 2 or more Vehicles in Household |
| Bolivians | 99.6 /100 | #73 | Exceptional 58.3% |
| Immigrants | Afghanistan | 99.6 /100 | #74 | Exceptional 58.3% |
| Poles | 99.5 /100 | #75 | Exceptional 58.3% |
| Creek | 99.5 /100 | #76 | Exceptional 58.3% |
| Slovenes | 99.5 /100 | #77 | Exceptional 58.3% |
| Lithuanians | 99.5 /100 | #78 | Exceptional 58.2% |
| Delaware | 99.4 /100 | #79 | Exceptional 58.2% |
| Immigrants | England | 99.3 /100 | #80 | Exceptional 58.1% |
| Immigrants | Iraq | 99.3 /100 | #81 | Exceptional 58.1% |
| Iranians | 99.3 /100 | #82 | Exceptional 58.1% |
| Icelanders | 99.2 /100 | #83 | Exceptional 58.0% |
| Maltese | 99.2 /100 | #84 | Exceptional 58.0% |
| Slovaks | 99.2 /100 | #85 | Exceptional 58.0% |
| Potawatomi | 99.1 /100 | #86 | Exceptional 58.0% |
| Thais | 99.1 /100 | #87 | Exceptional 57.9% |
Demographics Similar to Immigrants from Bulgaria by 2 or more Vehicles in Household
In terms of 2 or more vehicles in household, the demographic groups most similar to Immigrants from Bulgaria are Egyptian (54.3%, a difference of 0.0%), Immigrants from Saudi Arabia (54.2%, a difference of 0.060%), Immigrants from Hungary (54.2%, a difference of 0.070%), Turkish (54.3%, a difference of 0.090%), and Immigrants from Chile (54.2%, a difference of 0.090%).
| Demographics | Rating | Rank | 2 or more Vehicles in Household |
| Immigrants | North Macedonia | 14.9 /100 | #202 | Poor 54.4% |
| Immigrants | Peru | 14.3 /100 | #203 | Poor 54.4% |
| Immigrants | Belgium | 13.7 /100 | #204 | Poor 54.3% |
| Cheyenne | 13.6 /100 | #205 | Poor 54.3% |
| Immigrants | Latin America | 13.1 /100 | #206 | Poor 54.3% |
| Turks | 13.0 /100 | #207 | Poor 54.3% |
| Egyptians | 12.0 /100 | #208 | Poor 54.3% |
| Immigrants | Bulgaria | 12.0 /100 | #209 | Poor 54.3% |
| Immigrants | Saudi Arabia | 11.3 /100 | #210 | Poor 54.2% |
| Immigrants | Hungary | 11.3 /100 | #211 | Poor 54.2% |
| Immigrants | Chile | 11.1 /100 | #212 | Poor 54.2% |
| Guatemalans | 9.6 /100 | #213 | Tragic 54.1% |
| Immigrants | Czechoslovakia | 9.4 /100 | #214 | Tragic 54.1% |
| Aleuts | 9.3 /100 | #215 | Tragic 54.1% |
| Immigrants | Western Asia | 9.3 /100 | #216 | Tragic 54.1% |