Honduran vs Japanese 2 or more Vehicles in Household
COMPARE
Honduran
Japanese
2 or more Vehicles in Household
2 or more Vehicles in Household Comparison
Hondurans
Japanese
52.0%
2 OR MORE VEHICLES IN HOUSEHOLD
0.2/ 100
METRIC RATING
269th/ 347
METRIC RANK
57.5%
2 OR MORE VEHICLES IN HOUSEHOLD
98.0/ 100
METRIC RATING
110th/ 347
METRIC RANK
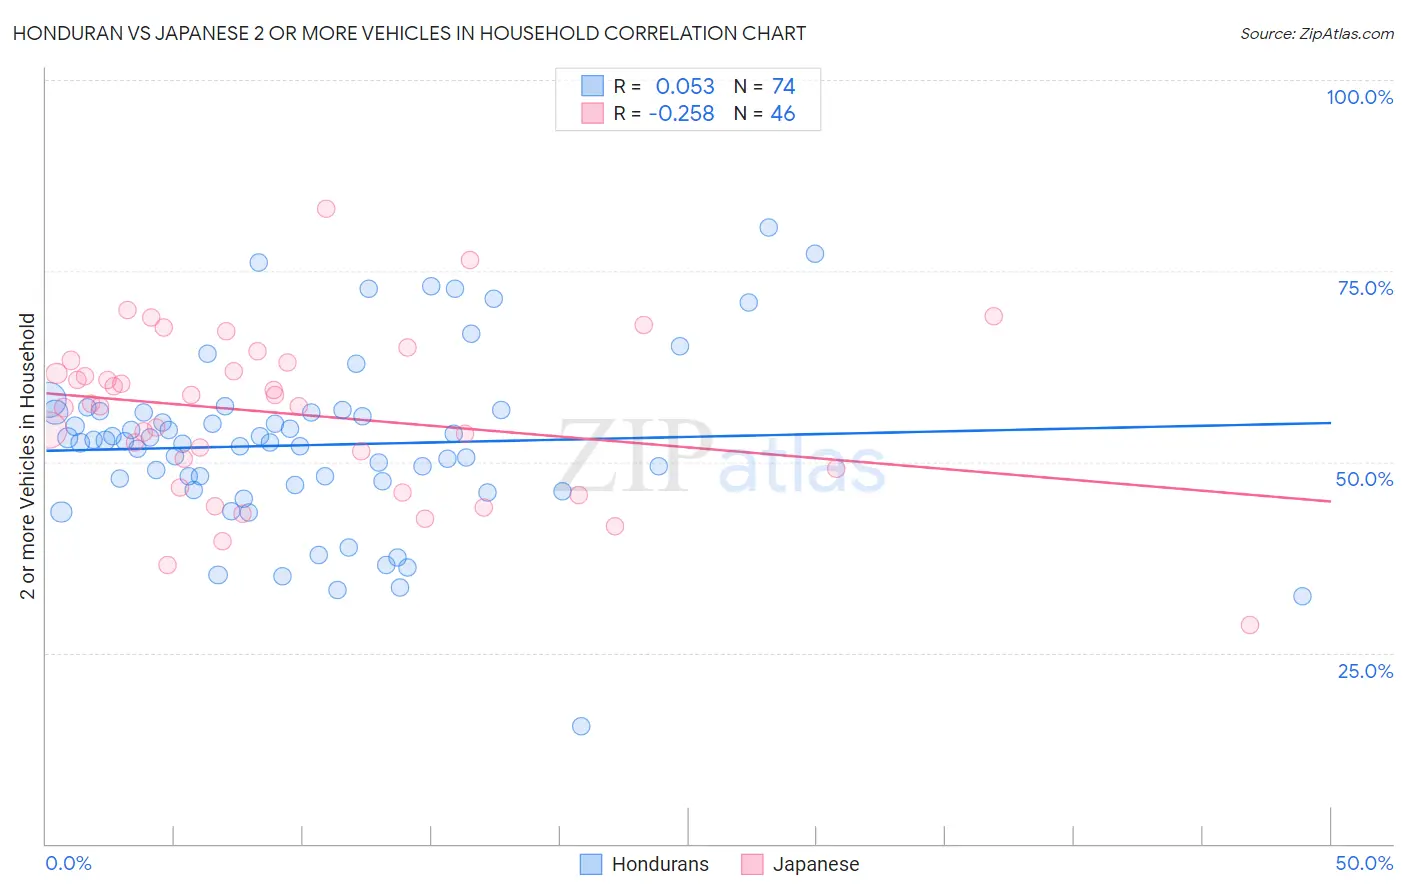
Honduran vs Japanese 2 or more Vehicles in Household Correlation Chart
The statistical analysis conducted on geographies consisting of 357,629,870 people shows a slight positive correlation between the proportion of Hondurans and percentage of households with 2 or more vehicles available in the United States with a correlation coefficient (R) of 0.053 and weighted average of 52.0%. Similarly, the statistical analysis conducted on geographies consisting of 249,112,523 people shows a weak negative correlation between the proportion of Japanese and percentage of households with 2 or more vehicles available in the United States with a correlation coefficient (R) of -0.258 and weighted average of 57.5%, a difference of 10.5%.
2 or more Vehicles in Household Correlation Summary
| Measurement | Honduran | Japanese |
| Minimum | 15.4% | 28.6% |
| Maximum | 80.6% | 83.2% |
| Range | 65.2% | 54.6% |
| Mean | 52.2% | 56.3% |
| Median | 52.6% | 57.5% |
| Interquartile 25% (IQ1) | 47.0% | 49.1% |
| Interquartile 75% (IQ3) | 56.5% | 63.0% |
| Interquartile Range (IQR) | 9.5% | 13.8% |
| Standard Deviation (Sample) | 11.5% | 10.8% |
| Standard Deviation (Population) | 11.4% | 10.6% |
Similar Demographics by 2 or more Vehicles in Household
Demographics Similar to Hondurans by 2 or more Vehicles in Household
In terms of 2 or more vehicles in household, the demographic groups most similar to Hondurans are Immigrants from Colombia (52.0%, a difference of 0.010%), Pima (52.0%, a difference of 0.010%), Immigrants from Ireland (52.0%, a difference of 0.020%), Immigrants from France (52.0%, a difference of 0.060%), and South American (51.9%, a difference of 0.19%).
| Demographics | Rating | Rank | 2 or more Vehicles in Household |
| Immigrants | Northern Africa | 0.4 /100 | #262 | Tragic 52.3% |
| Immigrants | Southern Europe | 0.4 /100 | #263 | Tragic 52.3% |
| Immigrants | Latvia | 0.4 /100 | #264 | Tragic 52.2% |
| Immigrants | Congo | 0.3 /100 | #265 | Tragic 52.1% |
| Immigrants | France | 0.2 /100 | #266 | Tragic 52.0% |
| Immigrants | Colombia | 0.2 /100 | #267 | Tragic 52.0% |
| Pima | 0.2 /100 | #268 | Tragic 52.0% |
| Hondurans | 0.2 /100 | #269 | Tragic 52.0% |
| Immigrants | Ireland | 0.2 /100 | #270 | Tragic 52.0% |
| South Americans | 0.2 /100 | #271 | Tragic 51.9% |
| Sub-Saharan Africans | 0.2 /100 | #272 | Tragic 51.9% |
| Israelis | 0.2 /100 | #273 | Tragic 51.9% |
| Africans | 0.2 /100 | #274 | Tragic 51.8% |
| Immigrants | Honduras | 0.2 /100 | #275 | Tragic 51.8% |
| Immigrants | Croatia | 0.2 /100 | #276 | Tragic 51.8% |
Demographics Similar to Japanese by 2 or more Vehicles in Household
In terms of 2 or more vehicles in household, the demographic groups most similar to Japanese are Immigrants from North America (57.5%, a difference of 0.020%), Greek (57.5%, a difference of 0.030%), Pueblo (57.5%, a difference of 0.040%), Immigrants from Canada (57.5%, a difference of 0.050%), and Immigrants from Netherlands (57.5%, a difference of 0.060%).
| Demographics | Rating | Rank | 2 or more Vehicles in Household |
| Jordanians | 98.2 /100 | #103 | Exceptional 57.6% |
| Immigrants | Indonesia | 98.2 /100 | #104 | Exceptional 57.6% |
| Immigrants | Korea | 98.2 /100 | #105 | Exceptional 57.6% |
| Immigrants | Oceania | 98.2 /100 | #106 | Exceptional 57.5% |
| Immigrants | Netherlands | 98.2 /100 | #107 | Exceptional 57.5% |
| Immigrants | Canada | 98.1 /100 | #108 | Exceptional 57.5% |
| Immigrants | North America | 98.1 /100 | #109 | Exceptional 57.5% |
| Japanese | 98.0 /100 | #110 | Exceptional 57.5% |
| Greeks | 98.0 /100 | #111 | Exceptional 57.5% |
| Pueblo | 98.0 /100 | #112 | Exceptional 57.5% |
| Zimbabweans | 96.9 /100 | #113 | Exceptional 57.2% |
| Immigrants | Lebanon | 96.8 /100 | #114 | Exceptional 57.2% |
| Chippewa | 96.6 /100 | #115 | Exceptional 57.2% |
| Immigrants | Jordan | 96.6 /100 | #116 | Exceptional 57.2% |
| Iraqis | 95.8 /100 | #117 | Exceptional 57.1% |