Honduran vs Immigrants from Trinidad and Tobago 2 or more Vehicles in Household
COMPARE
Honduran
Immigrants from Trinidad and Tobago
2 or more Vehicles in Household
2 or more Vehicles in Household Comparison
Hondurans
Immigrants from Trinidad and Tobago
52.0%
2 OR MORE VEHICLES IN HOUSEHOLD
0.2/ 100
METRIC RATING
269th/ 347
METRIC RANK
40.3%
2 OR MORE VEHICLES IN HOUSEHOLD
0.0/ 100
METRIC RATING
334th/ 347
METRIC RANK
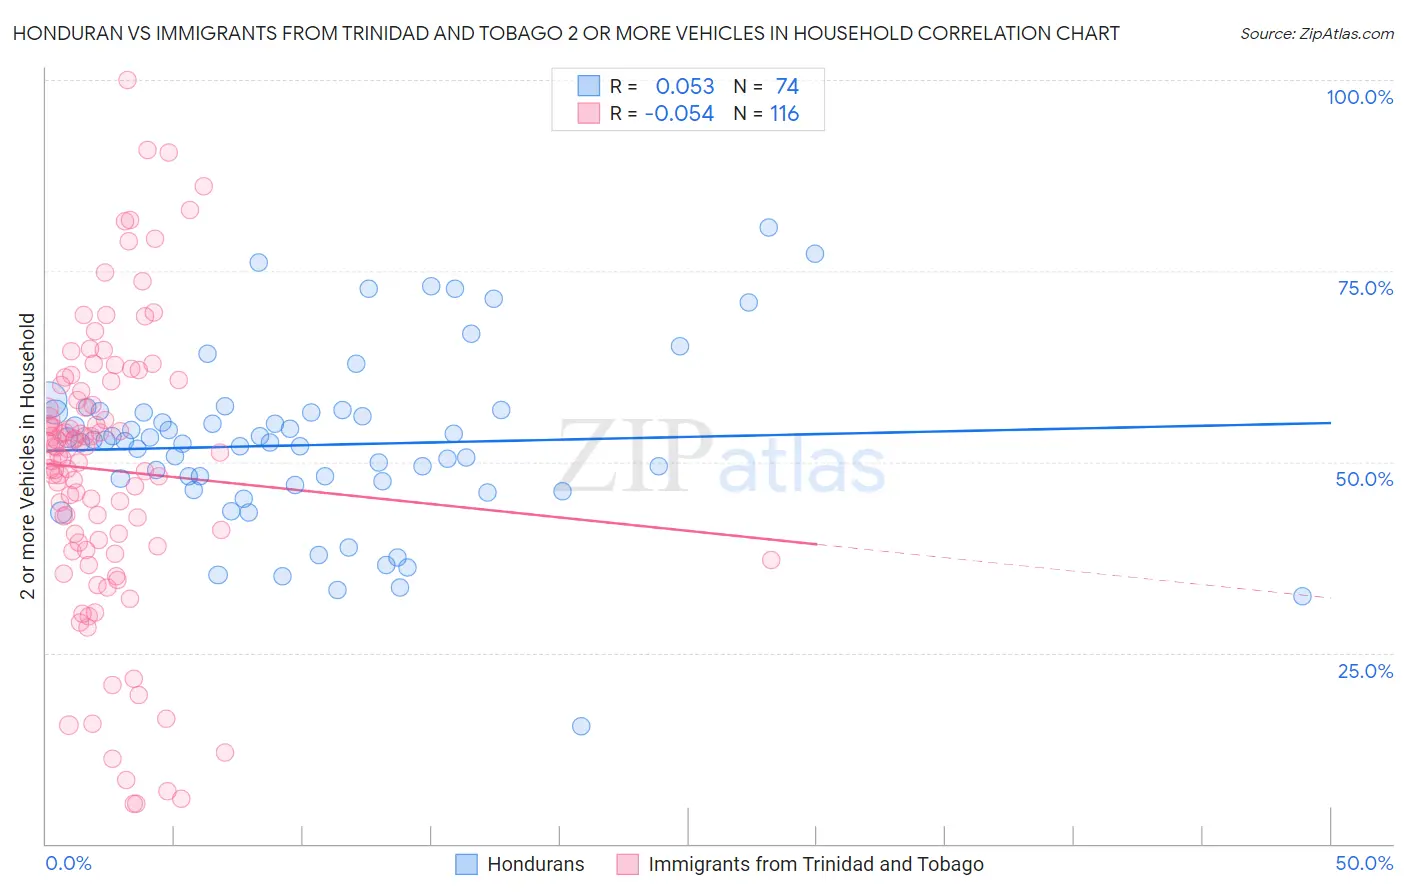
Honduran vs Immigrants from Trinidad and Tobago 2 or more Vehicles in Household Correlation Chart
The statistical analysis conducted on geographies consisting of 357,629,870 people shows a slight positive correlation between the proportion of Hondurans and percentage of households with 2 or more vehicles available in the United States with a correlation coefficient (R) of 0.053 and weighted average of 52.0%. Similarly, the statistical analysis conducted on geographies consisting of 223,484,323 people shows a slight negative correlation between the proportion of Immigrants from Trinidad and Tobago and percentage of households with 2 or more vehicles available in the United States with a correlation coefficient (R) of -0.054 and weighted average of 40.3%, a difference of 29.1%.
2 or more Vehicles in Household Correlation Summary
| Measurement | Honduran | Immigrants from Trinidad and Tobago |
| Minimum | 15.4% | 5.2% |
| Maximum | 80.6% | 100.0% |
| Range | 65.2% | 94.8% |
| Mean | 52.2% | 48.9% |
| Median | 52.6% | 50.9% |
| Interquartile 25% (IQ1) | 47.0% | 38.7% |
| Interquartile 75% (IQ3) | 56.5% | 59.7% |
| Interquartile Range (IQR) | 9.5% | 20.9% |
| Standard Deviation (Sample) | 11.5% | 18.9% |
| Standard Deviation (Population) | 11.4% | 18.9% |
Similar Demographics by 2 or more Vehicles in Household
Demographics Similar to Hondurans by 2 or more Vehicles in Household
In terms of 2 or more vehicles in household, the demographic groups most similar to Hondurans are Immigrants from Colombia (52.0%, a difference of 0.010%), Pima (52.0%, a difference of 0.010%), Immigrants from Ireland (52.0%, a difference of 0.020%), Immigrants from France (52.0%, a difference of 0.060%), and South American (51.9%, a difference of 0.19%).
| Demographics | Rating | Rank | 2 or more Vehicles in Household |
| Immigrants | Northern Africa | 0.4 /100 | #262 | Tragic 52.3% |
| Immigrants | Southern Europe | 0.4 /100 | #263 | Tragic 52.3% |
| Immigrants | Latvia | 0.4 /100 | #264 | Tragic 52.2% |
| Immigrants | Congo | 0.3 /100 | #265 | Tragic 52.1% |
| Immigrants | France | 0.2 /100 | #266 | Tragic 52.0% |
| Immigrants | Colombia | 0.2 /100 | #267 | Tragic 52.0% |
| Pima | 0.2 /100 | #268 | Tragic 52.0% |
| Hondurans | 0.2 /100 | #269 | Tragic 52.0% |
| Immigrants | Ireland | 0.2 /100 | #270 | Tragic 52.0% |
| South Americans | 0.2 /100 | #271 | Tragic 51.9% |
| Sub-Saharan Africans | 0.2 /100 | #272 | Tragic 51.9% |
| Israelis | 0.2 /100 | #273 | Tragic 51.9% |
| Africans | 0.2 /100 | #274 | Tragic 51.8% |
| Immigrants | Honduras | 0.2 /100 | #275 | Tragic 51.8% |
| Immigrants | Croatia | 0.2 /100 | #276 | Tragic 51.8% |
Demographics Similar to Immigrants from Trinidad and Tobago by 2 or more Vehicles in Household
In terms of 2 or more vehicles in household, the demographic groups most similar to Immigrants from Trinidad and Tobago are Immigrants from Ecuador (40.5%, a difference of 0.58%), Trinidadian and Tobagonian (40.9%, a difference of 1.5%), West Indian (41.3%, a difference of 2.5%), Immigrants from Dominica (41.6%, a difference of 3.4%), and Immigrants from Bangladesh (38.8%, a difference of 3.9%).
| Demographics | Rating | Rank | 2 or more Vehicles in Household |
| Immigrants | Yemen | 0.0 /100 | #327 | Tragic 42.8% |
| Inupiat | 0.0 /100 | #328 | Tragic 42.6% |
| Ecuadorians | 0.0 /100 | #329 | Tragic 42.0% |
| Immigrants | Dominica | 0.0 /100 | #330 | Tragic 41.6% |
| West Indians | 0.0 /100 | #331 | Tragic 41.3% |
| Trinidadians and Tobagonians | 0.0 /100 | #332 | Tragic 40.9% |
| Immigrants | Ecuador | 0.0 /100 | #333 | Tragic 40.5% |
| Immigrants | Trinidad and Tobago | 0.0 /100 | #334 | Tragic 40.3% |
| Immigrants | Bangladesh | 0.0 /100 | #335 | Tragic 38.8% |
| Vietnamese | 0.0 /100 | #336 | Tragic 38.5% |
| Barbadians | 0.0 /100 | #337 | Tragic 38.3% |
| Immigrants | Uzbekistan | 0.0 /100 | #338 | Tragic 37.9% |
| Immigrants | Barbados | 0.0 /100 | #339 | Tragic 35.8% |
| British West Indians | 0.0 /100 | #340 | Tragic 35.4% |
| Guyanese | 0.0 /100 | #341 | Tragic 35.4% |