Honduran vs Immigrants from Sudan 2 or more Vehicles in Household
COMPARE
Honduran
Immigrants from Sudan
2 or more Vehicles in Household
2 or more Vehicles in Household Comparison
Hondurans
Immigrants from Sudan
52.0%
2 OR MORE VEHICLES IN HOUSEHOLD
0.2/ 100
METRIC RATING
269th/ 347
METRIC RANK
52.8%
2 OR MORE VEHICLES IN HOUSEHOLD
1.0/ 100
METRIC RATING
251st/ 347
METRIC RANK
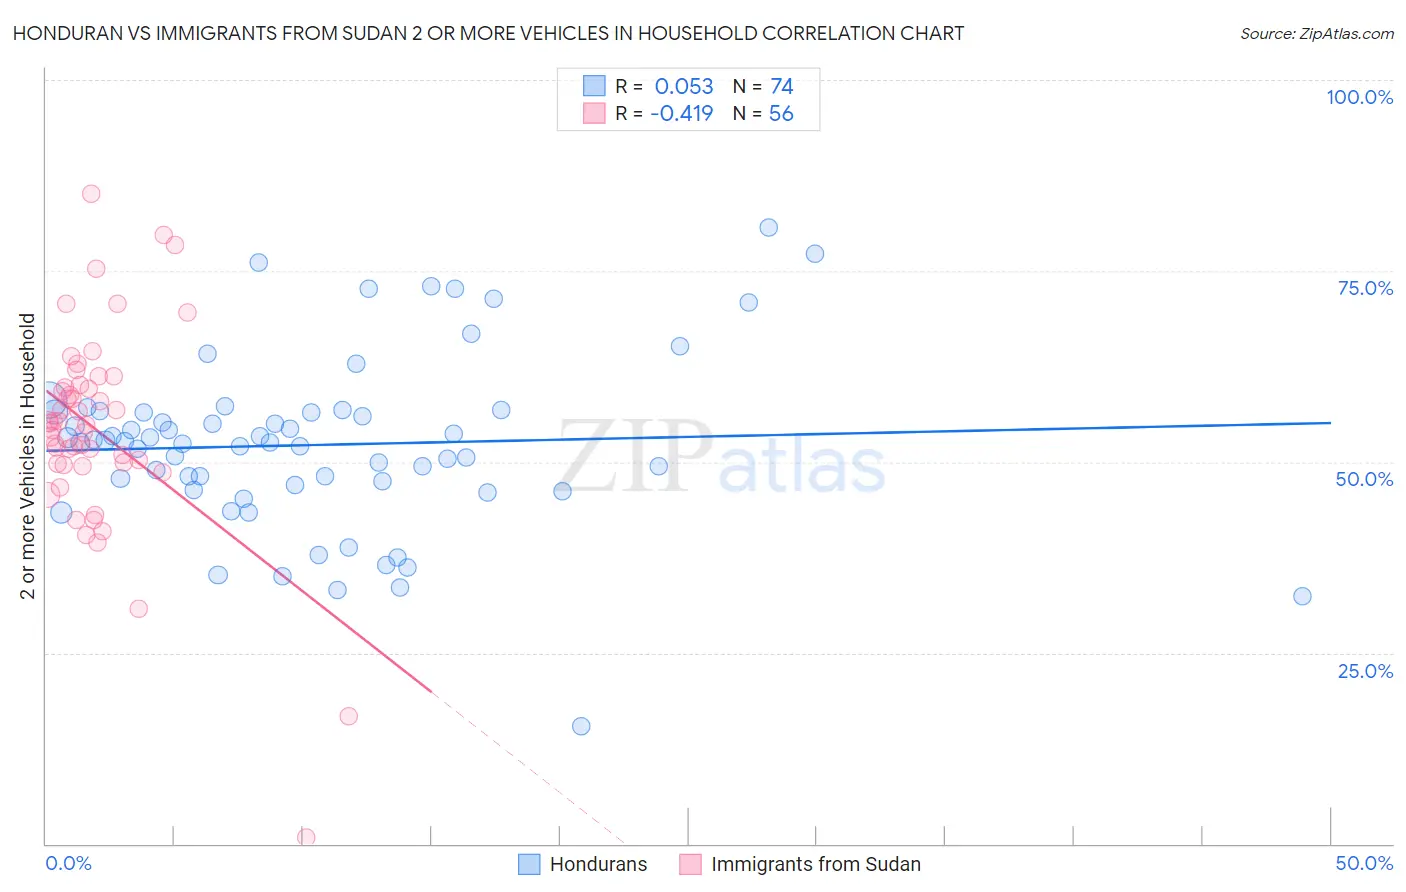
Honduran vs Immigrants from Sudan 2 or more Vehicles in Household Correlation Chart
The statistical analysis conducted on geographies consisting of 357,629,870 people shows a slight positive correlation between the proportion of Hondurans and percentage of households with 2 or more vehicles available in the United States with a correlation coefficient (R) of 0.053 and weighted average of 52.0%. Similarly, the statistical analysis conducted on geographies consisting of 118,954,580 people shows a moderate negative correlation between the proportion of Immigrants from Sudan and percentage of households with 2 or more vehicles available in the United States with a correlation coefficient (R) of -0.419 and weighted average of 52.8%, a difference of 1.5%.
2 or more Vehicles in Household Correlation Summary
| Measurement | Honduran | Immigrants from Sudan |
| Minimum | 15.4% | 0.83% |
| Maximum | 80.6% | 85.2% |
| Range | 65.2% | 84.3% |
| Mean | 52.2% | 54.2% |
| Median | 52.6% | 55.0% |
| Interquartile 25% (IQ1) | 47.0% | 49.7% |
| Interquartile 75% (IQ3) | 56.5% | 59.9% |
| Interquartile Range (IQR) | 9.5% | 10.2% |
| Standard Deviation (Sample) | 11.5% | 13.6% |
| Standard Deviation (Population) | 11.4% | 13.5% |
Demographics Similar to Hondurans and Immigrants from Sudan by 2 or more Vehicles in Household
In terms of 2 or more vehicles in household, the demographic groups most similar to Hondurans are Immigrants from Colombia (52.0%, a difference of 0.010%), Pima (52.0%, a difference of 0.010%), Immigrants from Ireland (52.0%, a difference of 0.020%), Immigrants from France (52.0%, a difference of 0.060%), and Immigrants from Congo (52.1%, a difference of 0.20%). Similarly, the demographic groups most similar to Immigrants from Sudan are Immigrants from Portugal (52.8%, a difference of 0.010%), Mongolian (52.8%, a difference of 0.030%), Nigerian (52.8%, a difference of 0.060%), Immigrants from Malaysia (52.7%, a difference of 0.25%), and Uruguayan (52.7%, a difference of 0.28%).
| Demographics | Rating | Rank | 2 or more Vehicles in Household |
| Mongolians | 1.0 /100 | #250 | Tragic 52.8% |
| Immigrants | Sudan | 1.0 /100 | #251 | Tragic 52.8% |
| Immigrants | Portugal | 1.0 /100 | #252 | Tragic 52.8% |
| Nigerians | 0.9 /100 | #253 | Tragic 52.8% |
| Immigrants | Malaysia | 0.8 /100 | #254 | Tragic 52.7% |
| Uruguayans | 0.7 /100 | #255 | Tragic 52.7% |
| Immigrants | Eritrea | 0.7 /100 | #256 | Tragic 52.6% |
| Immigrants | Hong Kong | 0.6 /100 | #257 | Tragic 52.6% |
| Central American Indians | 0.6 /100 | #258 | Tragic 52.5% |
| Alsatians | 0.6 /100 | #259 | Tragic 52.5% |
| Immigrants | Bahamas | 0.5 /100 | #260 | Tragic 52.5% |
| Immigrants | Australia | 0.5 /100 | #261 | Tragic 52.4% |
| Immigrants | Northern Africa | 0.4 /100 | #262 | Tragic 52.3% |
| Immigrants | Southern Europe | 0.4 /100 | #263 | Tragic 52.3% |
| Immigrants | Latvia | 0.4 /100 | #264 | Tragic 52.2% |
| Immigrants | Congo | 0.3 /100 | #265 | Tragic 52.1% |
| Immigrants | France | 0.2 /100 | #266 | Tragic 52.0% |
| Immigrants | Colombia | 0.2 /100 | #267 | Tragic 52.0% |
| Pima | 0.2 /100 | #268 | Tragic 52.0% |
| Hondurans | 0.2 /100 | #269 | Tragic 52.0% |
| Immigrants | Ireland | 0.2 /100 | #270 | Tragic 52.0% |