Honduran vs Guamanian/Chamorro 2 or more Vehicles in Household
COMPARE
Honduran
Guamanian/Chamorro
2 or more Vehicles in Household
2 or more Vehicles in Household Comparison
Hondurans
Guamanians/Chamorros
52.0%
2 OR MORE VEHICLES IN HOUSEHOLD
0.2/ 100
METRIC RATING
269th/ 347
METRIC RANK
60.5%
2 OR MORE VEHICLES IN HOUSEHOLD
100.0/ 100
METRIC RATING
28th/ 347
METRIC RANK
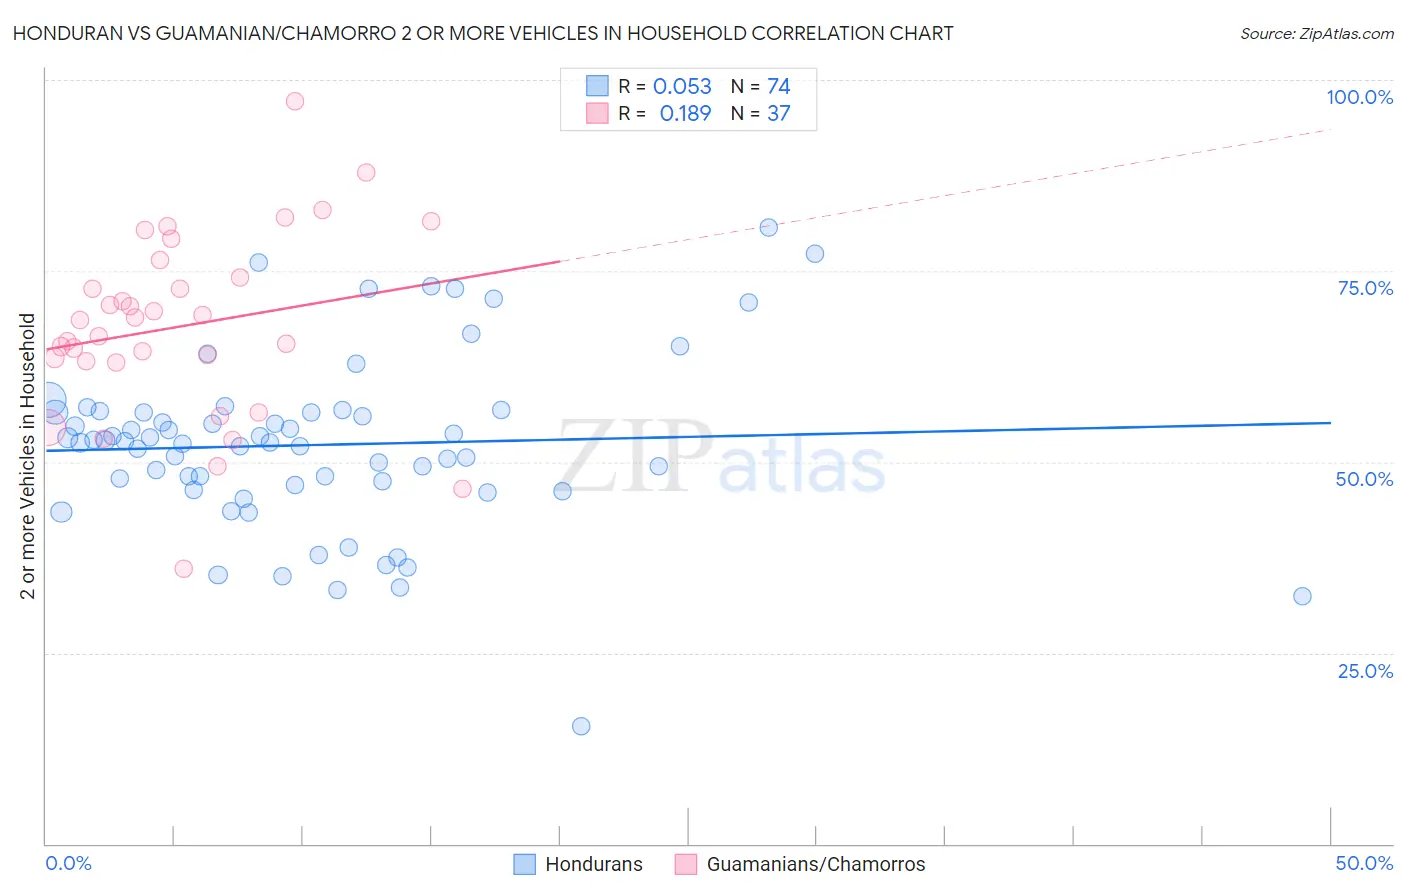
Honduran vs Guamanian/Chamorro 2 or more Vehicles in Household Correlation Chart
The statistical analysis conducted on geographies consisting of 357,629,870 people shows a slight positive correlation between the proportion of Hondurans and percentage of households with 2 or more vehicles available in the United States with a correlation coefficient (R) of 0.053 and weighted average of 52.0%. Similarly, the statistical analysis conducted on geographies consisting of 221,880,536 people shows a poor positive correlation between the proportion of Guamanians/Chamorros and percentage of households with 2 or more vehicles available in the United States with a correlation coefficient (R) of 0.189 and weighted average of 60.5%, a difference of 16.3%.
2 or more Vehicles in Household Correlation Summary
| Measurement | Honduran | Guamanian/Chamorro |
| Minimum | 15.4% | 36.1% |
| Maximum | 80.6% | 97.2% |
| Range | 65.2% | 61.2% |
| Mean | 52.2% | 67.8% |
| Median | 52.6% | 68.6% |
| Interquartile 25% (IQ1) | 47.0% | 63.0% |
| Interquartile 75% (IQ3) | 56.5% | 75.3% |
| Interquartile Range (IQR) | 9.5% | 12.3% |
| Standard Deviation (Sample) | 11.5% | 12.2% |
| Standard Deviation (Population) | 11.4% | 12.0% |
Similar Demographics by 2 or more Vehicles in Household
Demographics Similar to Hondurans by 2 or more Vehicles in Household
In terms of 2 or more vehicles in household, the demographic groups most similar to Hondurans are Immigrants from Colombia (52.0%, a difference of 0.010%), Pima (52.0%, a difference of 0.010%), Immigrants from Ireland (52.0%, a difference of 0.020%), Immigrants from France (52.0%, a difference of 0.060%), and South American (51.9%, a difference of 0.19%).
| Demographics | Rating | Rank | 2 or more Vehicles in Household |
| Immigrants | Northern Africa | 0.4 /100 | #262 | Tragic 52.3% |
| Immigrants | Southern Europe | 0.4 /100 | #263 | Tragic 52.3% |
| Immigrants | Latvia | 0.4 /100 | #264 | Tragic 52.2% |
| Immigrants | Congo | 0.3 /100 | #265 | Tragic 52.1% |
| Immigrants | France | 0.2 /100 | #266 | Tragic 52.0% |
| Immigrants | Colombia | 0.2 /100 | #267 | Tragic 52.0% |
| Pima | 0.2 /100 | #268 | Tragic 52.0% |
| Hondurans | 0.2 /100 | #269 | Tragic 52.0% |
| Immigrants | Ireland | 0.2 /100 | #270 | Tragic 52.0% |
| South Americans | 0.2 /100 | #271 | Tragic 51.9% |
| Sub-Saharan Africans | 0.2 /100 | #272 | Tragic 51.9% |
| Israelis | 0.2 /100 | #273 | Tragic 51.9% |
| Africans | 0.2 /100 | #274 | Tragic 51.8% |
| Immigrants | Honduras | 0.2 /100 | #275 | Tragic 51.8% |
| Immigrants | Croatia | 0.2 /100 | #276 | Tragic 51.8% |
Demographics Similar to Guamanians/Chamorros by 2 or more Vehicles in Household
In terms of 2 or more vehicles in household, the demographic groups most similar to Guamanians/Chamorros are Hawaiian (60.4%, a difference of 0.11%), Assyrian/Chaldean/Syriac (60.5%, a difference of 0.13%), Finnish (60.3%, a difference of 0.24%), Spanish American Indian (60.3%, a difference of 0.26%), and Arapaho (60.2%, a difference of 0.37%).
| Demographics | Rating | Rank | 2 or more Vehicles in Household |
| Koreans | 100.0 /100 | #21 | Exceptional 61.0% |
| Swiss | 100.0 /100 | #22 | Exceptional 61.0% |
| Scotch-Irish | 100.0 /100 | #23 | Exceptional 60.9% |
| Immigrants | Vietnam | 100.0 /100 | #24 | Exceptional 60.9% |
| Whites/Caucasians | 100.0 /100 | #25 | Exceptional 60.8% |
| Welsh | 100.0 /100 | #26 | Exceptional 60.8% |
| Assyrians/Chaldeans/Syriacs | 100.0 /100 | #27 | Exceptional 60.5% |
| Guamanians/Chamorros | 100.0 /100 | #28 | Exceptional 60.5% |
| Hawaiians | 100.0 /100 | #29 | Exceptional 60.4% |
| Finns | 100.0 /100 | #30 | Exceptional 60.3% |
| Spanish American Indians | 100.0 /100 | #31 | Exceptional 60.3% |
| Arapaho | 100.0 /100 | #32 | Exceptional 60.2% |
| Immigrants | Mexico | 100.0 /100 | #33 | Exceptional 60.2% |
| Spanish | 100.0 /100 | #34 | Exceptional 60.2% |
| Immigrants | Philippines | 100.0 /100 | #35 | Exceptional 60.1% |