Slovak vs Immigrants from Trinidad and Tobago 2 or more Vehicles in Household
COMPARE
Slovak
Immigrants from Trinidad and Tobago
2 or more Vehicles in Household
2 or more Vehicles in Household Comparison
Slovaks
Immigrants from Trinidad and Tobago
58.0%
2 OR MORE VEHICLES IN HOUSEHOLD
99.2/ 100
METRIC RATING
85th/ 347
METRIC RANK
40.3%
2 OR MORE VEHICLES IN HOUSEHOLD
0.0/ 100
METRIC RATING
334th/ 347
METRIC RANK
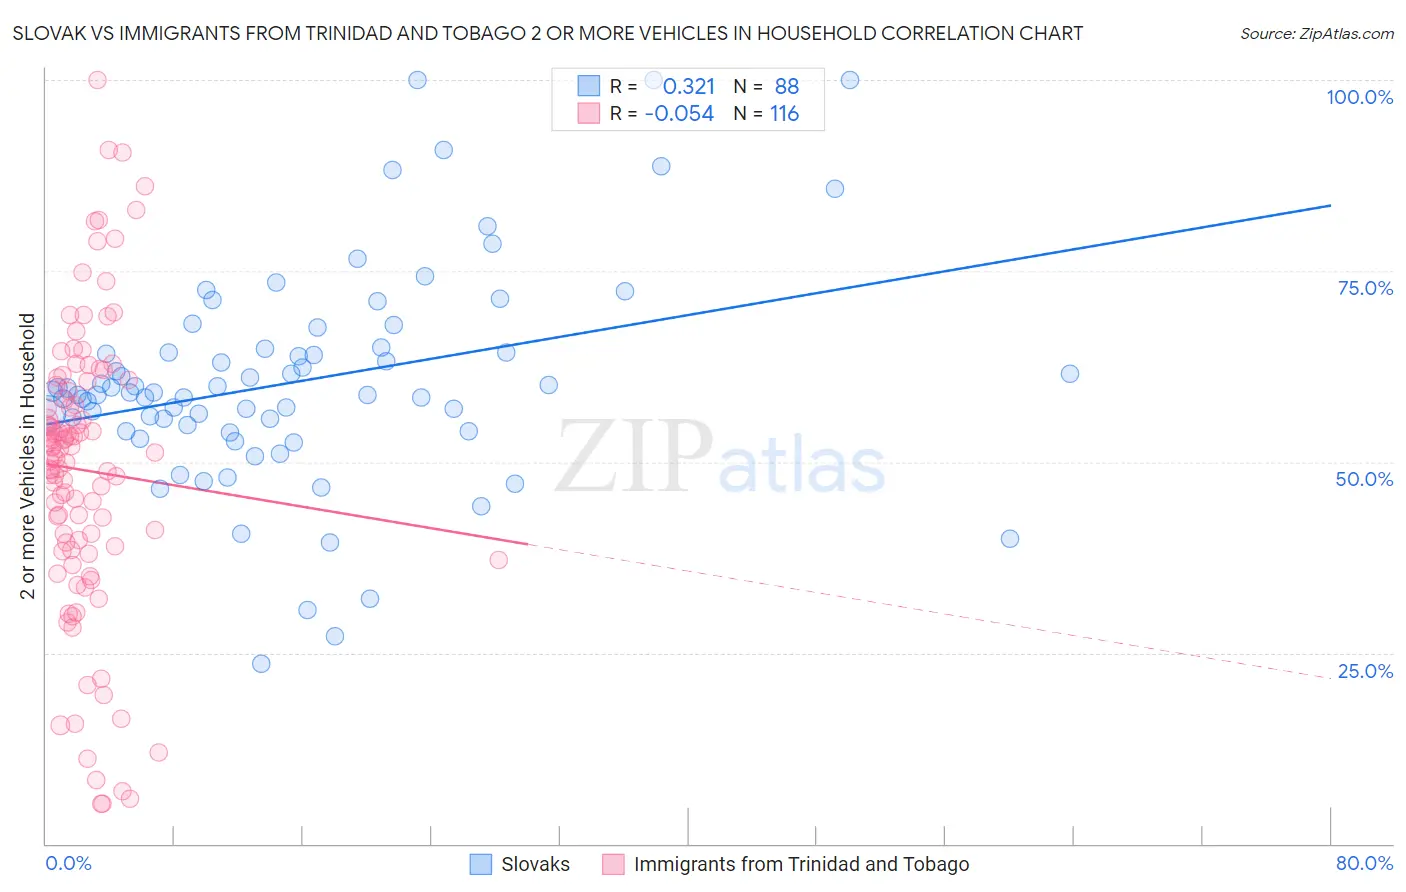
Slovak vs Immigrants from Trinidad and Tobago 2 or more Vehicles in Household Correlation Chart
The statistical analysis conducted on geographies consisting of 397,714,521 people shows a mild positive correlation between the proportion of Slovaks and percentage of households with 2 or more vehicles available in the United States with a correlation coefficient (R) of 0.321 and weighted average of 58.0%. Similarly, the statistical analysis conducted on geographies consisting of 223,484,323 people shows a slight negative correlation between the proportion of Immigrants from Trinidad and Tobago and percentage of households with 2 or more vehicles available in the United States with a correlation coefficient (R) of -0.054 and weighted average of 40.3%, a difference of 44.0%.
2 or more Vehicles in Household Correlation Summary
| Measurement | Slovak | Immigrants from Trinidad and Tobago |
| Minimum | 23.6% | 5.2% |
| Maximum | 100.0% | 100.0% |
| Range | 76.4% | 94.8% |
| Mean | 60.5% | 48.9% |
| Median | 59.1% | 50.9% |
| Interquartile 25% (IQ1) | 54.5% | 38.7% |
| Interquartile 75% (IQ3) | 64.6% | 59.7% |
| Interquartile Range (IQR) | 10.1% | 20.9% |
| Standard Deviation (Sample) | 14.2% | 18.9% |
| Standard Deviation (Population) | 14.1% | 18.9% |
Similar Demographics by 2 or more Vehicles in Household
Demographics Similar to Slovaks by 2 or more Vehicles in Household
In terms of 2 or more vehicles in household, the demographic groups most similar to Slovaks are Potawatomi (58.0%, a difference of 0.030%), Maltese (58.0%, a difference of 0.050%), Thai (57.9%, a difference of 0.070%), Icelander (58.0%, a difference of 0.080%), and Immigrants from Iran (57.9%, a difference of 0.080%).
| Demographics | Rating | Rank | 2 or more Vehicles in Household |
| Lithuanians | 99.5 /100 | #78 | Exceptional 58.2% |
| Delaware | 99.4 /100 | #79 | Exceptional 58.2% |
| Immigrants | England | 99.3 /100 | #80 | Exceptional 58.1% |
| Immigrants | Iraq | 99.3 /100 | #81 | Exceptional 58.1% |
| Iranians | 99.3 /100 | #82 | Exceptional 58.1% |
| Icelanders | 99.2 /100 | #83 | Exceptional 58.0% |
| Maltese | 99.2 /100 | #84 | Exceptional 58.0% |
| Slovaks | 99.2 /100 | #85 | Exceptional 58.0% |
| Potawatomi | 99.1 /100 | #86 | Exceptional 58.0% |
| Thais | 99.1 /100 | #87 | Exceptional 57.9% |
| Immigrants | Iran | 99.1 /100 | #88 | Exceptional 57.9% |
| Immigrants | Germany | 99.0 /100 | #89 | Exceptional 57.9% |
| Hispanics or Latinos | 99.0 /100 | #90 | Exceptional 57.9% |
| Pakistanis | 99.0 /100 | #91 | Exceptional 57.9% |
| Shoshone | 99.0 /100 | #92 | Exceptional 57.9% |
Demographics Similar to Immigrants from Trinidad and Tobago by 2 or more Vehicles in Household
In terms of 2 or more vehicles in household, the demographic groups most similar to Immigrants from Trinidad and Tobago are Immigrants from Ecuador (40.5%, a difference of 0.58%), Trinidadian and Tobagonian (40.9%, a difference of 1.5%), West Indian (41.3%, a difference of 2.5%), Immigrants from Dominica (41.6%, a difference of 3.4%), and Immigrants from Bangladesh (38.8%, a difference of 3.9%).
| Demographics | Rating | Rank | 2 or more Vehicles in Household |
| Immigrants | Yemen | 0.0 /100 | #327 | Tragic 42.8% |
| Inupiat | 0.0 /100 | #328 | Tragic 42.6% |
| Ecuadorians | 0.0 /100 | #329 | Tragic 42.0% |
| Immigrants | Dominica | 0.0 /100 | #330 | Tragic 41.6% |
| West Indians | 0.0 /100 | #331 | Tragic 41.3% |
| Trinidadians and Tobagonians | 0.0 /100 | #332 | Tragic 40.9% |
| Immigrants | Ecuador | 0.0 /100 | #333 | Tragic 40.5% |
| Immigrants | Trinidad and Tobago | 0.0 /100 | #334 | Tragic 40.3% |
| Immigrants | Bangladesh | 0.0 /100 | #335 | Tragic 38.8% |
| Vietnamese | 0.0 /100 | #336 | Tragic 38.5% |
| Barbadians | 0.0 /100 | #337 | Tragic 38.3% |
| Immigrants | Uzbekistan | 0.0 /100 | #338 | Tragic 37.9% |
| Immigrants | Barbados | 0.0 /100 | #339 | Tragic 35.8% |
| British West Indians | 0.0 /100 | #340 | Tragic 35.4% |
| Guyanese | 0.0 /100 | #341 | Tragic 35.4% |