Greek vs Immigrants from India Single Father Poverty
COMPARE
Greek
Immigrants from India
Single Father Poverty
Single Father Poverty Comparison
Greeks
Immigrants from India
17.1%
SINGLE FATHER POVERTY
1.3/ 100
METRIC RATING
247th/ 347
METRIC RANK
14.0%
SINGLE FATHER POVERTY
100.0/ 100
METRIC RATING
12th/ 347
METRIC RANK
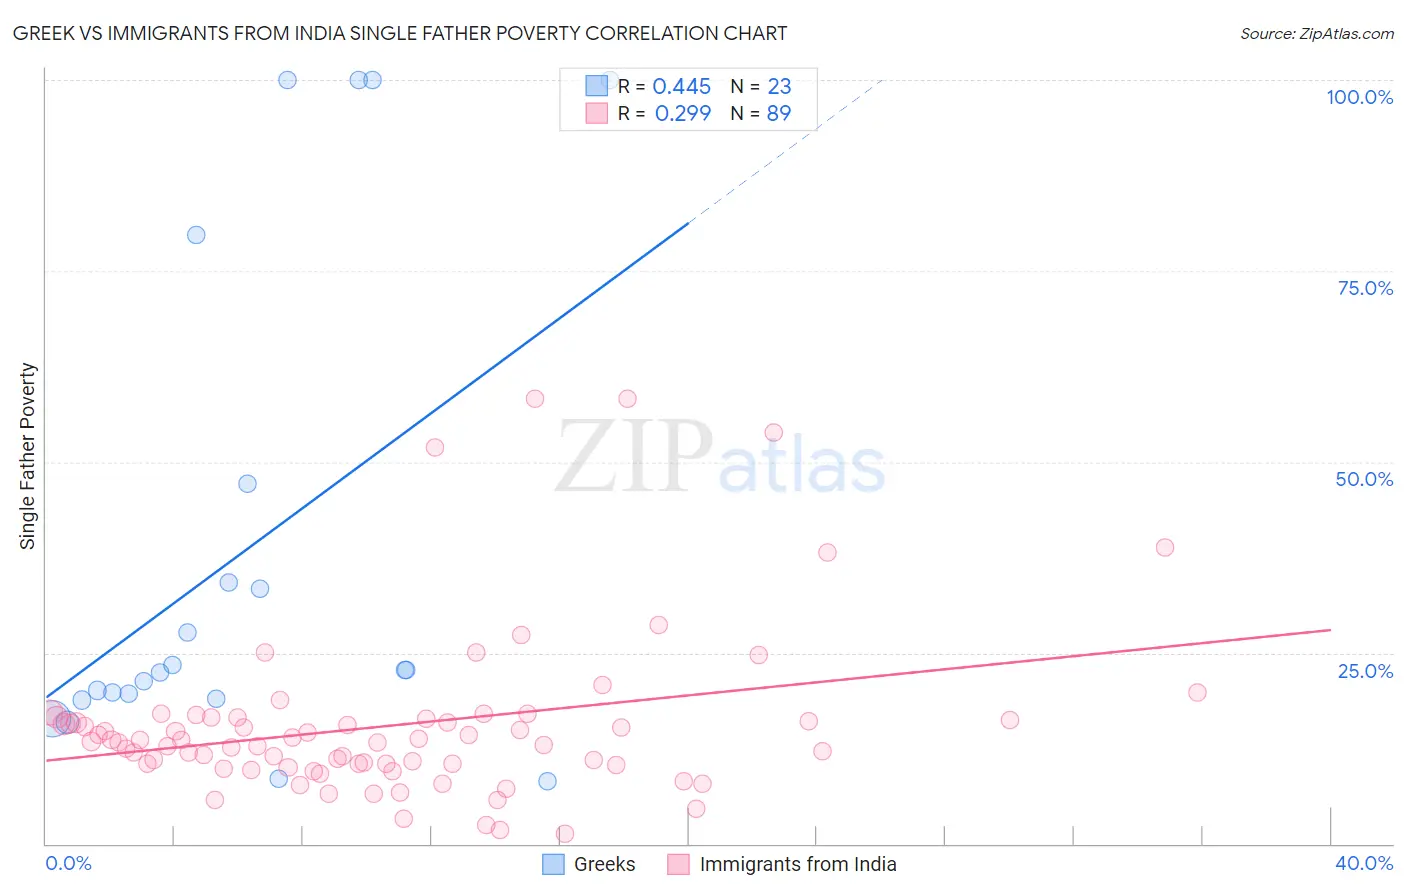
Greek vs Immigrants from India Single Father Poverty Correlation Chart
The statistical analysis conducted on geographies consisting of 361,572,090 people shows a moderate positive correlation between the proportion of Greeks and poverty level among single fathers in the United States with a correlation coefficient (R) of 0.445 and weighted average of 17.1%. Similarly, the statistical analysis conducted on geographies consisting of 333,180,346 people shows a weak positive correlation between the proportion of Immigrants from India and poverty level among single fathers in the United States with a correlation coefficient (R) of 0.299 and weighted average of 14.0%, a difference of 21.7%.
Single Father Poverty Correlation Summary
| Measurement | Greek | Immigrants from India |
| Minimum | 8.2% | 1.4% |
| Maximum | 100.0% | 58.3% |
| Range | 91.8% | 56.9% |
| Mean | 38.3% | 15.5% |
| Median | 22.7% | 13.3% |
| Interquartile 25% (IQ1) | 19.0% | 10.4% |
| Interquartile 75% (IQ3) | 47.2% | 16.5% |
| Interquartile Range (IQR) | 28.2% | 6.0% |
| Standard Deviation (Sample) | 32.3% | 10.8% |
| Standard Deviation (Population) | 31.6% | 10.8% |
Similar Demographics by Single Father Poverty
Demographics Similar to Greeks by Single Father Poverty
In terms of single father poverty, the demographic groups most similar to Greeks are Czechoslovakian (17.1%, a difference of 0.0%), Canadian (17.1%, a difference of 0.050%), Immigrants from Ireland (17.1%, a difference of 0.10%), Trinidadian and Tobagonian (17.0%, a difference of 0.14%), and Honduran (17.0%, a difference of 0.18%).
| Demographics | Rating | Rank | Single Father Poverty |
| Finns | 2.6 /100 | #240 | Tragic 16.9% |
| Czechs | 2.3 /100 | #241 | Tragic 17.0% |
| Moroccans | 2.1 /100 | #242 | Tragic 17.0% |
| Immigrants | Cabo Verde | 1.6 /100 | #243 | Tragic 17.0% |
| Hondurans | 1.6 /100 | #244 | Tragic 17.0% |
| Trinidadians and Tobagonians | 1.5 /100 | #245 | Tragic 17.0% |
| Immigrants | Ireland | 1.4 /100 | #246 | Tragic 17.1% |
| Greeks | 1.3 /100 | #247 | Tragic 17.1% |
| Czechoslovakians | 1.3 /100 | #248 | Tragic 17.1% |
| Canadians | 1.3 /100 | #249 | Tragic 17.1% |
| Austrians | 1.1 /100 | #250 | Tragic 17.1% |
| Luxembourgers | 1.1 /100 | #251 | Tragic 17.1% |
| Croatians | 1.0 /100 | #252 | Tragic 17.1% |
| Cree | 1.0 /100 | #253 | Tragic 17.1% |
| Immigrants | Honduras | 0.9 /100 | #254 | Tragic 17.1% |
Demographics Similar to Immigrants from India by Single Father Poverty
In terms of single father poverty, the demographic groups most similar to Immigrants from India are Filipino (14.0%, a difference of 0.0%), Immigrants from Philippines (14.0%, a difference of 0.15%), Korean (14.0%, a difference of 0.41%), Afghan (14.0%, a difference of 0.51%), and Immigrants from Vietnam (14.1%, a difference of 0.85%).
| Demographics | Rating | Rank | Single Father Poverty |
| Immigrants | Ethiopia | 100.0 /100 | #5 | Exceptional 13.4% |
| Ethiopians | 100.0 /100 | #6 | Exceptional 13.5% |
| Immigrants | Taiwan | 100.0 /100 | #7 | Exceptional 13.7% |
| Samoans | 100.0 /100 | #8 | Exceptional 13.8% |
| Afghans | 100.0 /100 | #9 | Exceptional 14.0% |
| Koreans | 100.0 /100 | #10 | Exceptional 14.0% |
| Filipinos | 100.0 /100 | #11 | Exceptional 14.0% |
| Immigrants | India | 100.0 /100 | #12 | Exceptional 14.0% |
| Immigrants | Philippines | 100.0 /100 | #13 | Exceptional 14.0% |
| Immigrants | Vietnam | 100.0 /100 | #14 | Exceptional 14.1% |
| Sri Lankans | 100.0 /100 | #15 | Exceptional 14.2% |
| Immigrants | Iran | 100.0 /100 | #16 | Exceptional 14.2% |
| Immigrants | Hong Kong | 100.0 /100 | #17 | Exceptional 14.2% |
| Soviet Union | 100.0 /100 | #18 | Exceptional 14.3% |
| Immigrants | Iraq | 100.0 /100 | #19 | Exceptional 14.3% |