Immigrants from Bahamas vs Immigrants from Taiwan 3 or more Vehicles in Household
COMPARE
Immigrants from Bahamas
Immigrants from Taiwan
3 or more Vehicles in Household
3 or more Vehicles in Household Comparison
Immigrants from Bahamas
Immigrants from Taiwan
17.4%
3 OR MORE VEHICLES IN HOUSEHOLD
0.3/ 100
METRIC RATING
278th/ 347
METRIC RANK
22.1%
3 OR MORE VEHICLES IN HOUSEHOLD
99.9/ 100
METRIC RATING
64th/ 347
METRIC RANK
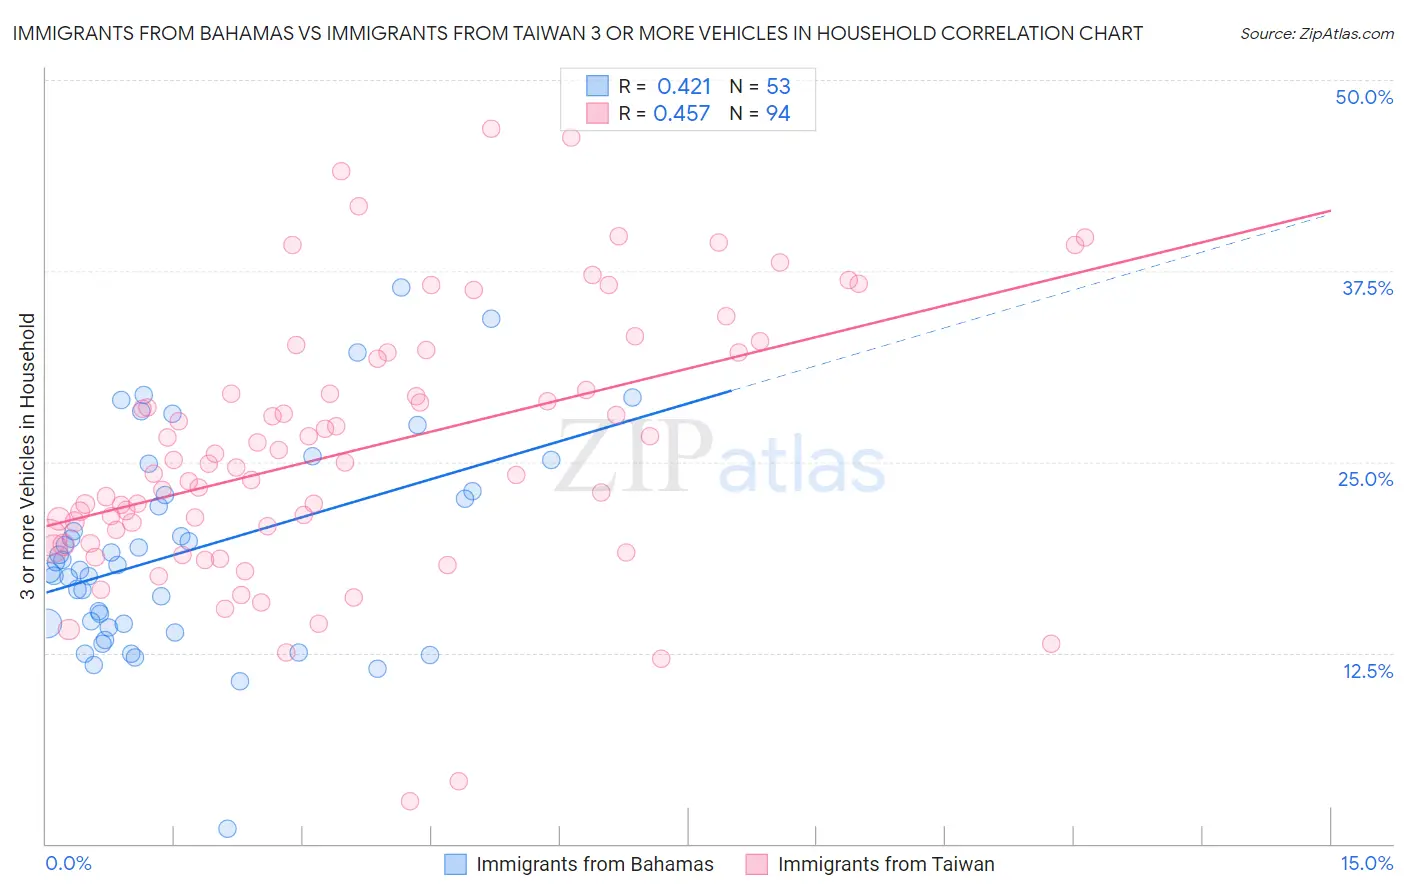
Immigrants from Bahamas vs Immigrants from Taiwan 3 or more Vehicles in Household Correlation Chart
The statistical analysis conducted on geographies consisting of 104,594,814 people shows a moderate positive correlation between the proportion of Immigrants from Bahamas and percentage of households with 3 or more vehicles available in the United States with a correlation coefficient (R) of 0.421 and weighted average of 17.4%. Similarly, the statistical analysis conducted on geographies consisting of 298,037,283 people shows a moderate positive correlation between the proportion of Immigrants from Taiwan and percentage of households with 3 or more vehicles available in the United States with a correlation coefficient (R) of 0.457 and weighted average of 22.1%, a difference of 27.1%.
3 or more Vehicles in Household Correlation Summary
| Measurement | Immigrants from Bahamas | Immigrants from Taiwan |
| Minimum | 1.0% | 2.7% |
| Maximum | 36.4% | 46.8% |
| Range | 35.4% | 44.0% |
| Mean | 19.2% | 25.8% |
| Median | 18.2% | 24.8% |
| Interquartile 25% (IQ1) | 14.3% | 20.1% |
| Interquartile 75% (IQ3) | 22.9% | 31.7% |
| Interquartile Range (IQR) | 8.6% | 11.6% |
| Standard Deviation (Sample) | 6.8% | 8.6% |
| Standard Deviation (Population) | 6.7% | 8.6% |
Similar Demographics by 3 or more Vehicles in Household
Demographics Similar to Immigrants from Bahamas by 3 or more Vehicles in Household
In terms of 3 or more vehicles in household, the demographic groups most similar to Immigrants from Bahamas are Immigrants from Kazakhstan (17.4%, a difference of 0.010%), Immigrants from Eastern Europe (17.4%, a difference of 0.050%), Brazilian (17.4%, a difference of 0.090%), Immigrants from Latvia (17.4%, a difference of 0.10%), and Okinawan (17.4%, a difference of 0.23%).
| Demographics | Rating | Rank | 3 or more Vehicles in Household |
| South Americans | 0.6 /100 | #271 | Tragic 17.6% |
| Immigrants | Africa | 0.5 /100 | #272 | Tragic 17.6% |
| Immigrants | Sudan | 0.5 /100 | #273 | Tragic 17.6% |
| Immigrants | Bosnia and Herzegovina | 0.5 /100 | #274 | Tragic 17.5% |
| Immigrants | Ukraine | 0.4 /100 | #275 | Tragic 17.5% |
| Okinawans | 0.4 /100 | #276 | Tragic 17.4% |
| Brazilians | 0.4 /100 | #277 | Tragic 17.4% |
| Immigrants | Bahamas | 0.3 /100 | #278 | Tragic 17.4% |
| Immigrants | Kazakhstan | 0.3 /100 | #279 | Tragic 17.4% |
| Immigrants | Eastern Europe | 0.3 /100 | #280 | Tragic 17.4% |
| Immigrants | Latvia | 0.3 /100 | #281 | Tragic 17.4% |
| Immigrants | Ireland | 0.3 /100 | #282 | Tragic 17.3% |
| Blacks/African Americans | 0.3 /100 | #283 | Tragic 17.3% |
| Immigrants | Colombia | 0.3 /100 | #284 | Tragic 17.3% |
| Immigrants | Croatia | 0.2 /100 | #285 | Tragic 17.2% |
Demographics Similar to Immigrants from Taiwan by 3 or more Vehicles in Household
In terms of 3 or more vehicles in household, the demographic groups most similar to Immigrants from Taiwan are Chickasaw (22.2%, a difference of 0.33%), Pima (22.0%, a difference of 0.42%), Fijian (22.2%, a difference of 0.49%), Bhutanese (22.2%, a difference of 0.54%), and Northern European (22.0%, a difference of 0.56%).
| Demographics | Rating | Rank | 3 or more Vehicles in Household |
| Pennsylvania Germans | 100.0 /100 | #57 | Exceptional 22.3% |
| Spaniards | 100.0 /100 | #58 | Exceptional 22.3% |
| Navajo | 100.0 /100 | #59 | Exceptional 22.3% |
| Finns | 99.9 /100 | #60 | Exceptional 22.3% |
| Bhutanese | 99.9 /100 | #61 | Exceptional 22.2% |
| Fijians | 99.9 /100 | #62 | Exceptional 22.2% |
| Chickasaw | 99.9 /100 | #63 | Exceptional 22.2% |
| Immigrants | Taiwan | 99.9 /100 | #64 | Exceptional 22.1% |
| Pima | 99.9 /100 | #65 | Exceptional 22.0% |
| Northern Europeans | 99.9 /100 | #66 | Exceptional 22.0% |
| Alaskan Athabascans | 99.9 /100 | #67 | Exceptional 21.9% |
| British | 99.9 /100 | #68 | Exceptional 21.9% |
| Creek | 99.9 /100 | #69 | Exceptional 21.9% |
| Bangladeshis | 99.8 /100 | #70 | Exceptional 21.9% |
| Potawatomi | 99.8 /100 | #71 | Exceptional 21.9% |