French vs Austrian 2 or more Vehicles in Household
COMPARE
French
Austrian
2 or more Vehicles in Household
2 or more Vehicles in Household Comparison
French
Austrians
59.8%
2 OR MORE VEHICLES IN HOUSEHOLD
100.0/ 100
METRIC RATING
44th/ 347
METRIC RANK
58.4%
2 OR MORE VEHICLES IN HOUSEHOLD
99.6/ 100
METRIC RATING
72nd/ 347
METRIC RANK
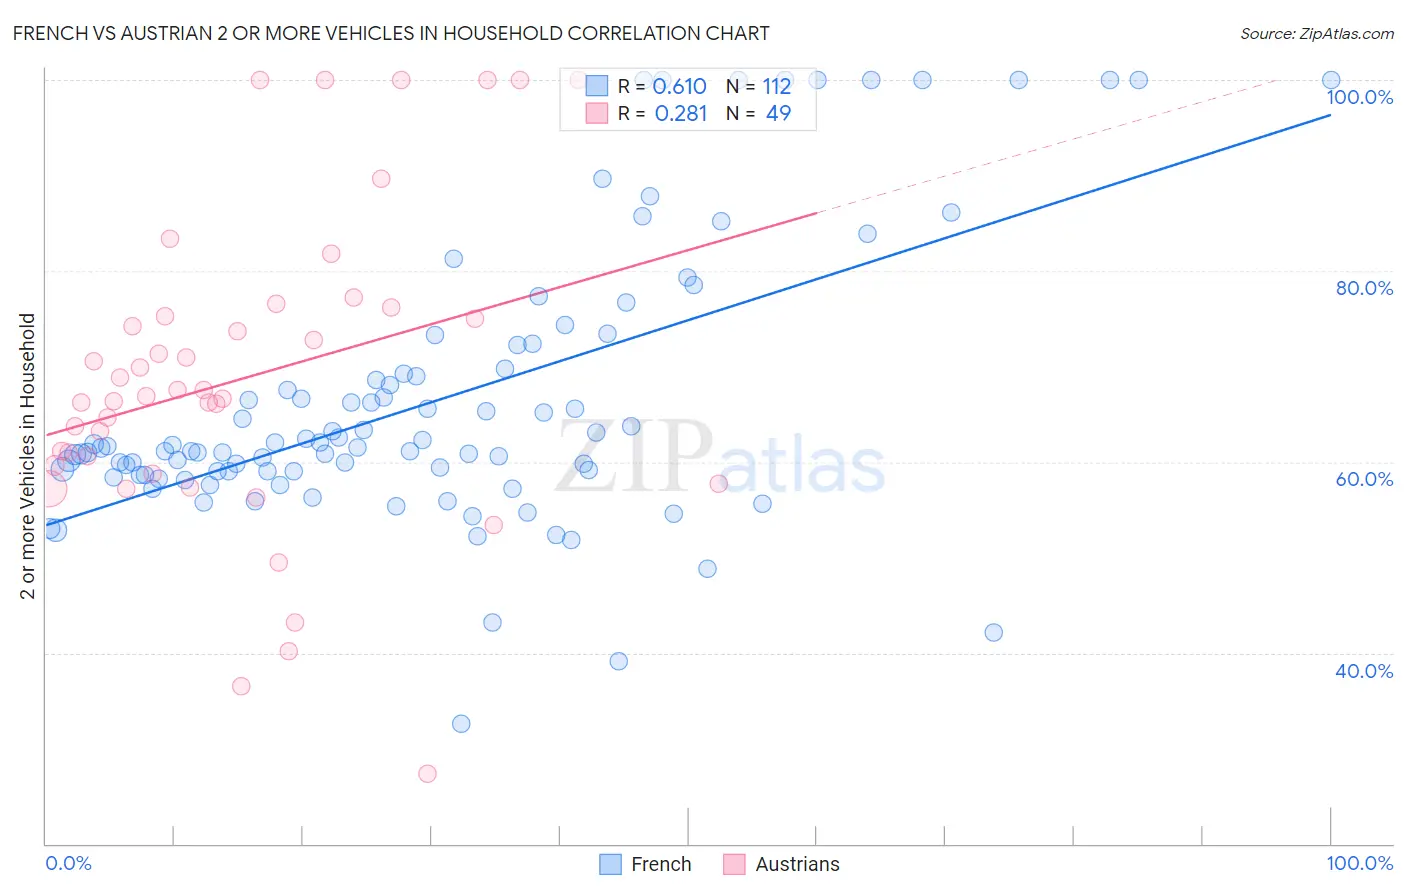
French vs Austrian 2 or more Vehicles in Household Correlation Chart
The statistical analysis conducted on geographies consisting of 571,870,956 people shows a significant positive correlation between the proportion of French and percentage of households with 2 or more vehicles available in the United States with a correlation coefficient (R) of 0.610 and weighted average of 59.8%. Similarly, the statistical analysis conducted on geographies consisting of 451,851,074 people shows a weak positive correlation between the proportion of Austrians and percentage of households with 2 or more vehicles available in the United States with a correlation coefficient (R) of 0.281 and weighted average of 58.4%, a difference of 2.3%.
2 or more Vehicles in Household Correlation Summary
| Measurement | French | Austrian |
| Minimum | 32.5% | 27.3% |
| Maximum | 100.0% | 100.0% |
| Range | 67.5% | 72.7% |
| Mean | 66.4% | 68.8% |
| Median | 61.5% | 66.8% |
| Interquartile 25% (IQ1) | 58.8% | 59.2% |
| Interquartile 75% (IQ3) | 69.5% | 75.7% |
| Interquartile Range (IQR) | 10.7% | 16.5% |
| Standard Deviation (Sample) | 14.5% | 16.5% |
| Standard Deviation (Population) | 14.4% | 16.3% |
Similar Demographics by 2 or more Vehicles in Household
Demographics Similar to French by 2 or more Vehicles in Household
In terms of 2 or more vehicles in household, the demographic groups most similar to French are Immigrants from Taiwan (59.7%, a difference of 0.040%), Czechoslovakian (59.8%, a difference of 0.060%), Malaysian (59.8%, a difference of 0.14%), Northern European (59.9%, a difference of 0.15%), and Cherokee (59.9%, a difference of 0.17%).
| Demographics | Rating | Rank | 2 or more Vehicles in Household |
| Irish | 100.0 /100 | #37 | Exceptional 60.1% |
| Americans | 100.0 /100 | #38 | Exceptional 60.0% |
| British | 100.0 /100 | #39 | Exceptional 60.0% |
| Cherokee | 100.0 /100 | #40 | Exceptional 59.9% |
| Northern Europeans | 100.0 /100 | #41 | Exceptional 59.9% |
| Malaysians | 100.0 /100 | #42 | Exceptional 59.8% |
| Czechoslovakians | 100.0 /100 | #43 | Exceptional 59.8% |
| French | 100.0 /100 | #44 | Exceptional 59.8% |
| Immigrants | Taiwan | 100.0 /100 | #45 | Exceptional 59.7% |
| Immigrants | South Eastern Asia | 100.0 /100 | #46 | Exceptional 59.6% |
| Yaqui | 99.9 /100 | #47 | Exceptional 59.3% |
| Immigrants | India | 99.9 /100 | #48 | Exceptional 59.3% |
| Belgians | 99.9 /100 | #49 | Exceptional 59.3% |
| Choctaw | 99.9 /100 | #50 | Exceptional 59.3% |
| Spaniards | 99.9 /100 | #51 | Exceptional 59.2% |
Demographics Similar to Austrians by 2 or more Vehicles in Household
In terms of 2 or more vehicles in household, the demographic groups most similar to Austrians are Bangladeshi (58.4%, a difference of 0.030%), Italian (58.4%, a difference of 0.050%), Bolivian (58.3%, a difference of 0.12%), Immigrants from Afghanistan (58.3%, a difference of 0.13%), and Pennsylvania German (58.5%, a difference of 0.16%).
| Demographics | Rating | Rank | 2 or more Vehicles in Household |
| Immigrants | Central America | 99.7 /100 | #65 | Exceptional 58.6% |
| Croatians | 99.7 /100 | #66 | Exceptional 58.6% |
| Laotians | 99.7 /100 | #67 | Exceptional 58.6% |
| Canadians | 99.7 /100 | #68 | Exceptional 58.6% |
| Pennsylvania Germans | 99.7 /100 | #69 | Exceptional 58.5% |
| Italians | 99.6 /100 | #70 | Exceptional 58.4% |
| Bangladeshis | 99.6 /100 | #71 | Exceptional 58.4% |
| Austrians | 99.6 /100 | #72 | Exceptional 58.4% |
| Bolivians | 99.6 /100 | #73 | Exceptional 58.3% |
| Immigrants | Afghanistan | 99.6 /100 | #74 | Exceptional 58.3% |
| Poles | 99.5 /100 | #75 | Exceptional 58.3% |
| Creek | 99.5 /100 | #76 | Exceptional 58.3% |
| Slovenes | 99.5 /100 | #77 | Exceptional 58.3% |
| Lithuanians | 99.5 /100 | #78 | Exceptional 58.2% |
| Delaware | 99.4 /100 | #79 | Exceptional 58.2% |