Filipino vs Bangladeshi No Vehicles in Household
COMPARE
Filipino
Bangladeshi
No Vehicles in Household
No Vehicles in Household Comparison
Filipinos
Bangladeshis
10.4%
NO VEHICLES IN HOUSEHOLD
50.1/ 100
METRIC RATING
173rd/ 347
METRIC RANK
8.7%
NO VEHICLES IN HOUSEHOLD
99.3/ 100
METRIC RATING
86th/ 347
METRIC RANK
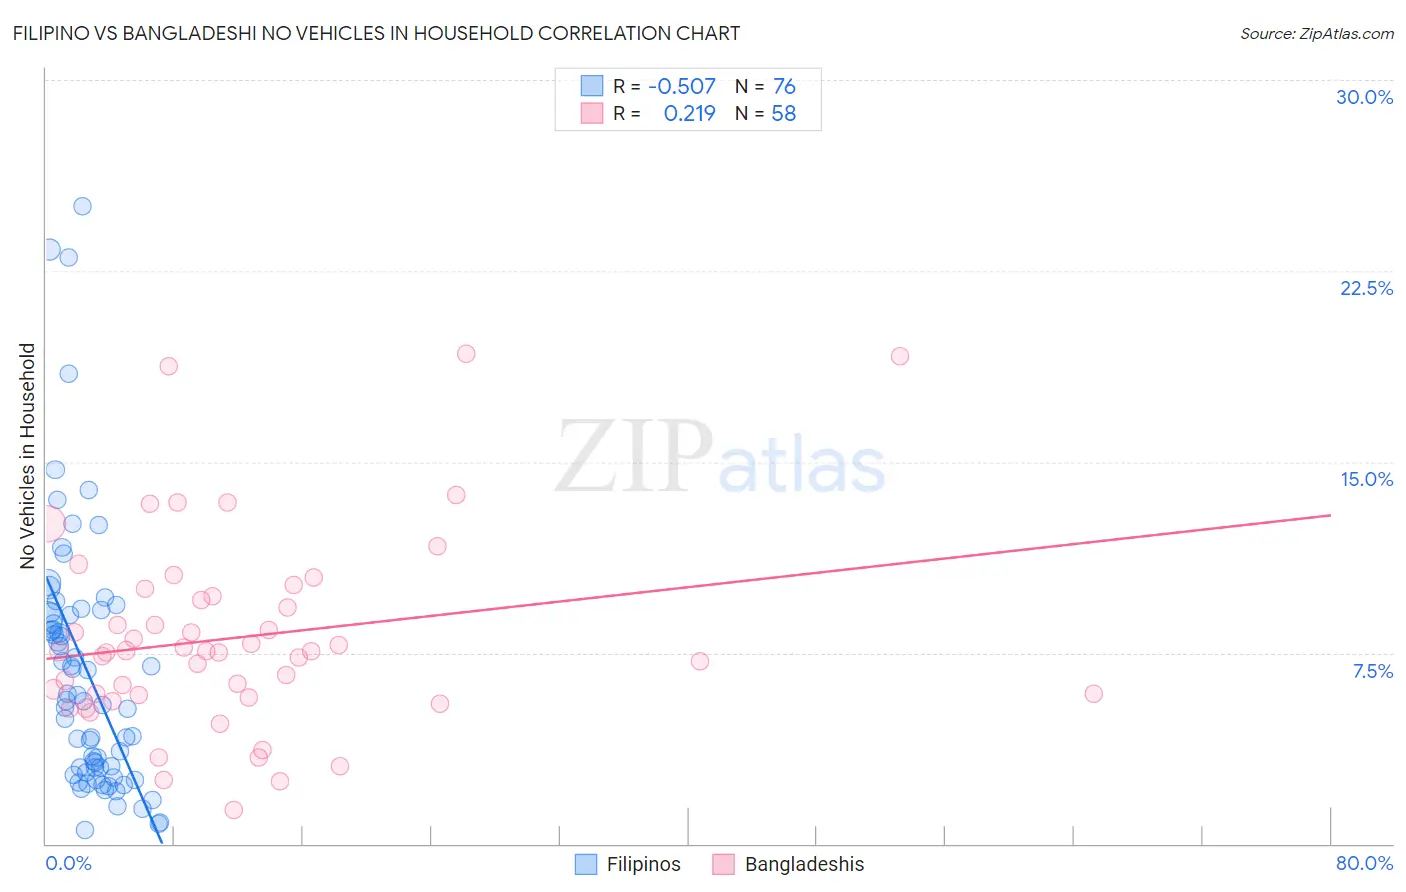
Filipino vs Bangladeshi No Vehicles in Household Correlation Chart
The statistical analysis conducted on geographies consisting of 253,938,776 people shows a substantial negative correlation between the proportion of Filipinos and percentage of households with no vehicle available in the United States with a correlation coefficient (R) of -0.507 and weighted average of 10.4%. Similarly, the statistical analysis conducted on geographies consisting of 141,214,962 people shows a weak positive correlation between the proportion of Bangladeshis and percentage of households with no vehicle available in the United States with a correlation coefficient (R) of 0.219 and weighted average of 8.7%, a difference of 20.1%.
No Vehicles in Household Correlation Summary
| Measurement | Filipino | Bangladeshi |
| Minimum | 0.54% | 1.3% |
| Maximum | 25.0% | 19.3% |
| Range | 24.5% | 17.9% |
| Mean | 6.8% | 8.1% |
| Median | 5.6% | 7.5% |
| Interquartile 25% (IQ1) | 2.9% | 5.8% |
| Interquartile 75% (IQ3) | 9.0% | 9.7% |
| Interquartile Range (IQR) | 6.1% | 3.9% |
| Standard Deviation (Sample) | 5.1% | 3.8% |
| Standard Deviation (Population) | 5.1% | 3.8% |
Similar Demographics by No Vehicles in Household
Demographics Similar to Filipinos by No Vehicles in Household
In terms of no vehicles in household, the demographic groups most similar to Filipinos are Immigrants from Sudan (10.4%, a difference of 0.010%), Immigrants from Burma/Myanmar (10.4%, a difference of 0.13%), French American Indian (10.4%, a difference of 0.13%), Immigrants from El Salvador (10.4%, a difference of 0.14%), and Brazilian (10.4%, a difference of 0.22%).
| Demographics | Rating | Rank | No Vehicles in Household |
| Immigrants | Costa Rica | 60.5 /100 | #166 | Good 10.3% |
| Immigrants | Saudi Arabia | 58.8 /100 | #167 | Average 10.3% |
| Indonesians | 56.7 /100 | #168 | Average 10.3% |
| Lumbee | 54.7 /100 | #169 | Average 10.3% |
| Immigrants | Latin America | 53.2 /100 | #170 | Average 10.4% |
| Hmong | 52.7 /100 | #171 | Average 10.4% |
| Brazilians | 51.7 /100 | #172 | Average 10.4% |
| Filipinos | 50.1 /100 | #173 | Average 10.4% |
| Immigrants | Sudan | 50.0 /100 | #174 | Average 10.4% |
| Immigrants | Burma/Myanmar | 49.1 /100 | #175 | Average 10.4% |
| French American Indians | 49.1 /100 | #176 | Average 10.4% |
| Immigrants | El Salvador | 49.1 /100 | #177 | Average 10.4% |
| Immigrants | Ethiopia | 48.0 /100 | #178 | Average 10.4% |
| Ethiopians | 45.8 /100 | #179 | Average 10.5% |
| Arabs | 45.3 /100 | #180 | Average 10.5% |
Demographics Similar to Bangladeshis by No Vehicles in Household
In terms of no vehicles in household, the demographic groups most similar to Bangladeshis are Lebanese (8.7%, a difference of 0.11%), Immigrants from Jordan (8.7%, a difference of 0.16%), Immigrants from England (8.7%, a difference of 0.22%), Osage (8.7%, a difference of 0.34%), and Italian (8.6%, a difference of 0.41%).
| Demographics | Rating | Rank | No Vehicles in Household |
| Portuguese | 99.5 /100 | #79 | Exceptional 8.6% |
| Bolivians | 99.4 /100 | #80 | Exceptional 8.6% |
| Tsimshian | 99.4 /100 | #81 | Exceptional 8.6% |
| Immigrants | South Eastern Asia | 99.4 /100 | #82 | Exceptional 8.6% |
| Italians | 99.4 /100 | #83 | Exceptional 8.6% |
| Immigrants | Jordan | 99.3 /100 | #84 | Exceptional 8.7% |
| Lebanese | 99.3 /100 | #85 | Exceptional 8.7% |
| Bangladeshis | 99.3 /100 | #86 | Exceptional 8.7% |
| Immigrants | England | 99.2 /100 | #87 | Exceptional 8.7% |
| Osage | 99.2 /100 | #88 | Exceptional 8.7% |
| Immigrants | Cuba | 99.2 /100 | #89 | Exceptional 8.7% |
| Bhutanese | 99.2 /100 | #90 | Exceptional 8.7% |
| Immigrants | Germany | 99.1 /100 | #91 | Exceptional 8.7% |
| Immigrants | Canada | 99.1 /100 | #92 | Exceptional 8.7% |
| Immigrants | North America | 99.1 /100 | #93 | Exceptional 8.7% |