Filipino vs Immigrants from Bahamas No Vehicles in Household
COMPARE
Filipino
Immigrants from Bahamas
No Vehicles in Household
No Vehicles in Household Comparison
Filipinos
Immigrants from Bahamas
10.4%
NO VEHICLES IN HOUSEHOLD
50.1/ 100
METRIC RATING
173rd/ 347
METRIC RANK
9.9%
NO VEHICLES IN HOUSEHOLD
81.2/ 100
METRIC RATING
144th/ 347
METRIC RANK
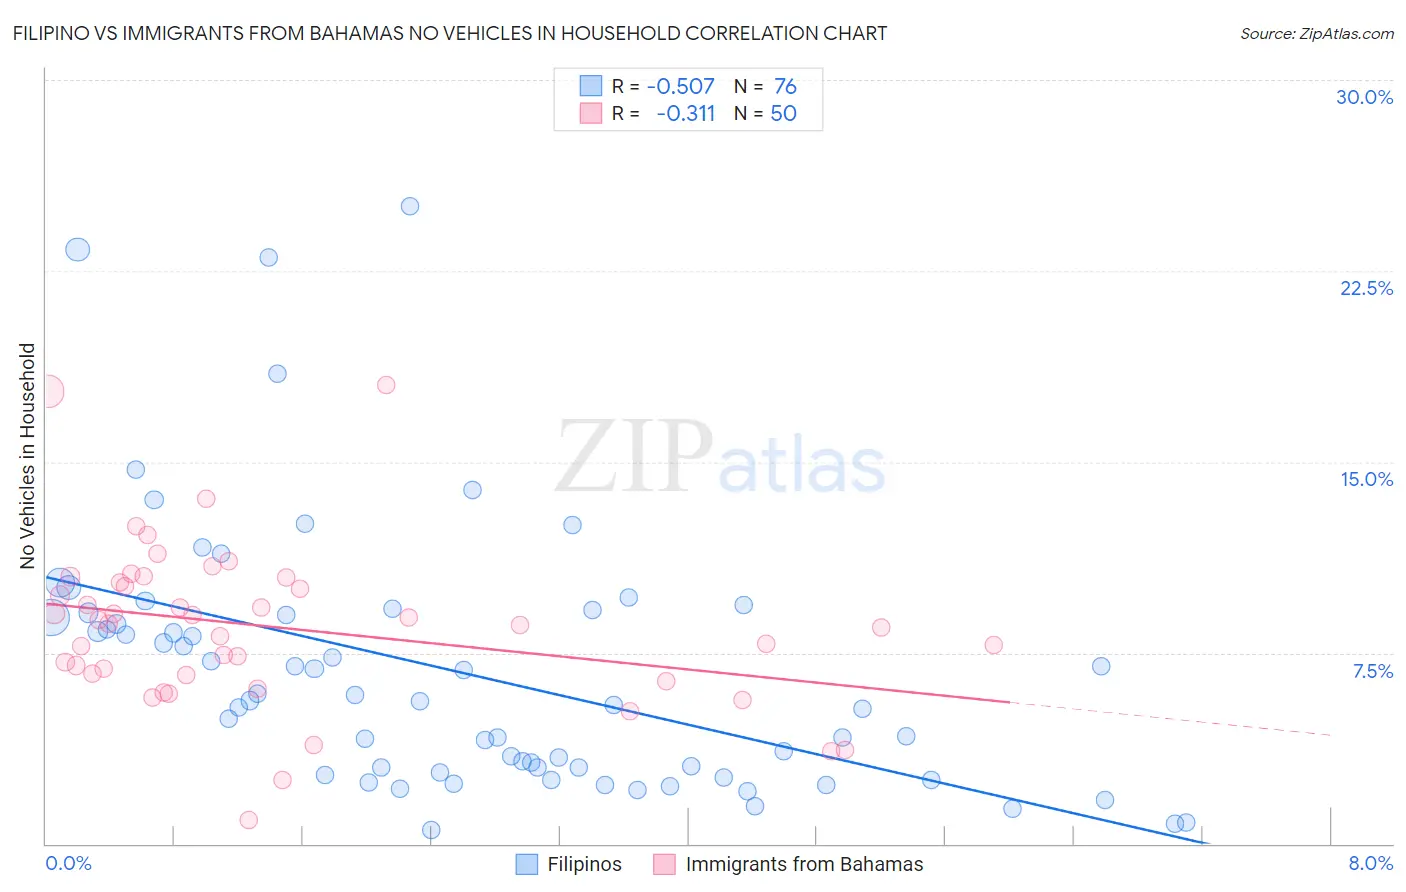
Filipino vs Immigrants from Bahamas No Vehicles in Household Correlation Chart
The statistical analysis conducted on geographies consisting of 253,938,776 people shows a substantial negative correlation between the proportion of Filipinos and percentage of households with no vehicle available in the United States with a correlation coefficient (R) of -0.507 and weighted average of 10.4%. Similarly, the statistical analysis conducted on geographies consisting of 104,565,234 people shows a mild negative correlation between the proportion of Immigrants from Bahamas and percentage of households with no vehicle available in the United States with a correlation coefficient (R) of -0.311 and weighted average of 9.9%, a difference of 5.2%.
No Vehicles in Household Correlation Summary
| Measurement | Filipino | Immigrants from Bahamas |
| Minimum | 0.54% | 0.94% |
| Maximum | 25.0% | 18.0% |
| Range | 24.5% | 17.1% |
| Mean | 6.8% | 8.5% |
| Median | 5.6% | 8.6% |
| Interquartile 25% (IQ1) | 2.9% | 6.6% |
| Interquartile 75% (IQ3) | 9.0% | 10.2% |
| Interquartile Range (IQR) | 6.1% | 3.6% |
| Standard Deviation (Sample) | 5.1% | 3.2% |
| Standard Deviation (Population) | 5.1% | 3.2% |
Similar Demographics by No Vehicles in Household
Demographics Similar to Filipinos by No Vehicles in Household
In terms of no vehicles in household, the demographic groups most similar to Filipinos are Immigrants from Sudan (10.4%, a difference of 0.010%), Immigrants from Burma/Myanmar (10.4%, a difference of 0.13%), French American Indian (10.4%, a difference of 0.13%), Immigrants from El Salvador (10.4%, a difference of 0.14%), and Brazilian (10.4%, a difference of 0.22%).
| Demographics | Rating | Rank | No Vehicles in Household |
| Immigrants | Costa Rica | 60.5 /100 | #166 | Good 10.3% |
| Immigrants | Saudi Arabia | 58.8 /100 | #167 | Average 10.3% |
| Indonesians | 56.7 /100 | #168 | Average 10.3% |
| Lumbee | 54.7 /100 | #169 | Average 10.3% |
| Immigrants | Latin America | 53.2 /100 | #170 | Average 10.4% |
| Hmong | 52.7 /100 | #171 | Average 10.4% |
| Brazilians | 51.7 /100 | #172 | Average 10.4% |
| Filipinos | 50.1 /100 | #173 | Average 10.4% |
| Immigrants | Sudan | 50.0 /100 | #174 | Average 10.4% |
| Immigrants | Burma/Myanmar | 49.1 /100 | #175 | Average 10.4% |
| French American Indians | 49.1 /100 | #176 | Average 10.4% |
| Immigrants | El Salvador | 49.1 /100 | #177 | Average 10.4% |
| Immigrants | Ethiopia | 48.0 /100 | #178 | Average 10.4% |
| Ethiopians | 45.8 /100 | #179 | Average 10.5% |
| Arabs | 45.3 /100 | #180 | Average 10.5% |
Demographics Similar to Immigrants from Bahamas by No Vehicles in Household
In terms of no vehicles in household, the demographic groups most similar to Immigrants from Bahamas are Chilean (9.9%, a difference of 0.0%), Bahamian (9.9%, a difference of 0.030%), Hungarian (9.9%, a difference of 0.26%), Immigrants from Nicaragua (9.9%, a difference of 0.31%), and Immigrants from Zimbabwe (9.9%, a difference of 0.35%).
| Demographics | Rating | Rank | No Vehicles in Household |
| Immigrants | Moldova | 84.6 /100 | #137 | Excellent 9.8% |
| Estonians | 84.2 /100 | #138 | Excellent 9.8% |
| Marshallese | 84.0 /100 | #139 | Excellent 9.8% |
| Immigrants | Lithuania | 84.0 /100 | #140 | Excellent 9.8% |
| Sudanese | 83.1 /100 | #141 | Excellent 9.8% |
| Immigrants | Zimbabwe | 82.6 /100 | #142 | Excellent 9.9% |
| Chileans | 81.2 /100 | #143 | Excellent 9.9% |
| Immigrants | Bahamas | 81.2 /100 | #144 | Excellent 9.9% |
| Bahamians | 81.0 /100 | #145 | Excellent 9.9% |
| Hungarians | 80.0 /100 | #146 | Excellent 9.9% |
| Immigrants | Nicaragua | 79.8 /100 | #147 | Good 9.9% |
| Immigrants | Bosnia and Herzegovina | 79.1 /100 | #148 | Good 9.9% |
| Immigrants | Uganda | 76.1 /100 | #149 | Good 10.0% |
| Colombians | 73.9 /100 | #150 | Good 10.0% |
| Immigrants | Eastern Africa | 73.8 /100 | #151 | Good 10.0% |