Filipino vs Immigrants from Trinidad and Tobago No Vehicles in Household
COMPARE
Filipino
Immigrants from Trinidad and Tobago
No Vehicles in Household
No Vehicles in Household Comparison
Filipinos
Immigrants from Trinidad and Tobago
10.4%
NO VEHICLES IN HOUSEHOLD
50.1/ 100
METRIC RATING
173rd/ 347
METRIC RANK
24.6%
NO VEHICLES IN HOUSEHOLD
0.0/ 100
METRIC RATING
333rd/ 347
METRIC RANK
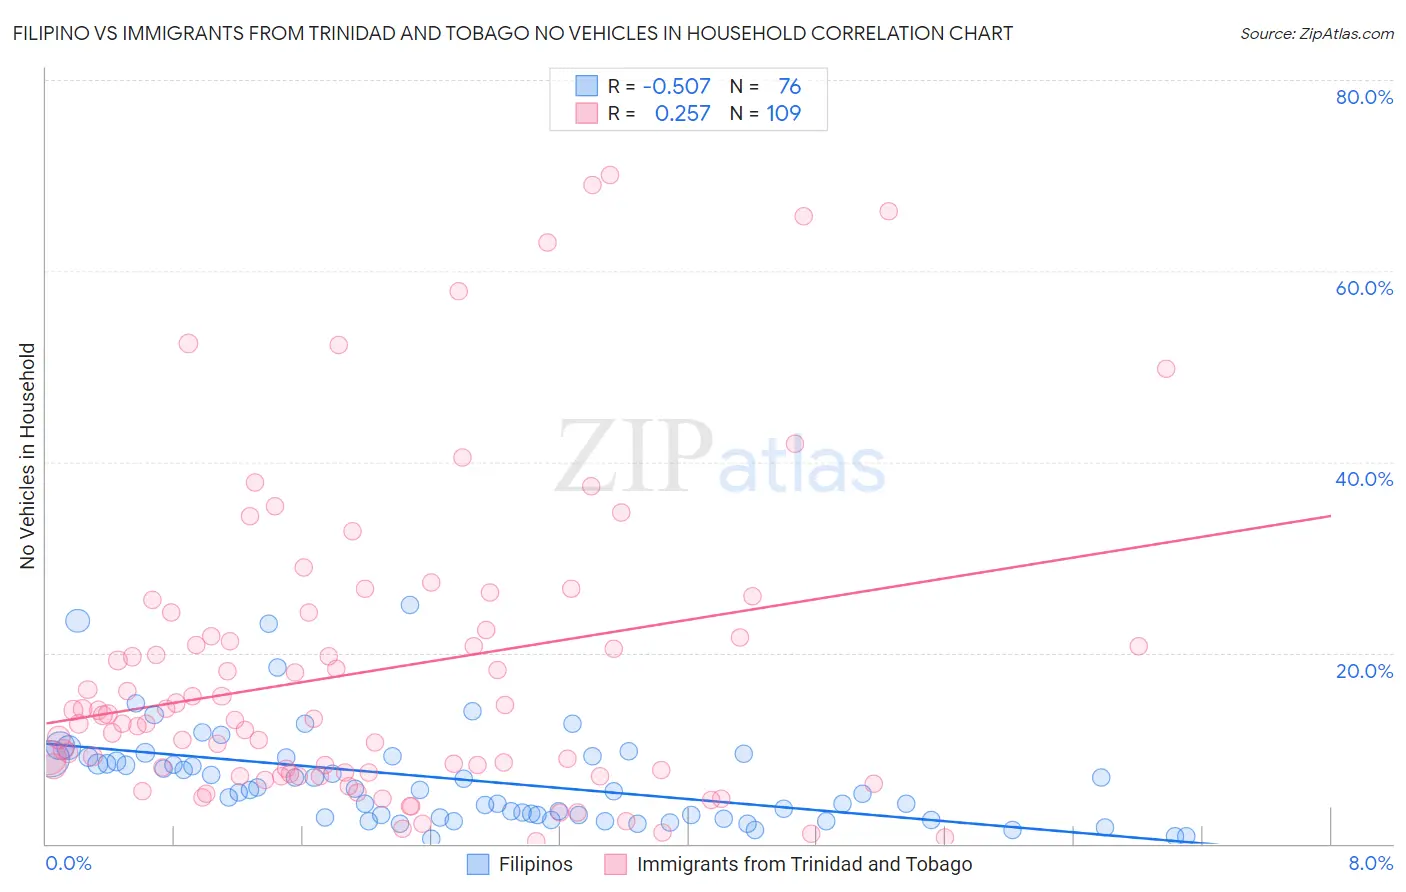
Filipino vs Immigrants from Trinidad and Tobago No Vehicles in Household Correlation Chart
The statistical analysis conducted on geographies consisting of 253,938,776 people shows a substantial negative correlation between the proportion of Filipinos and percentage of households with no vehicle available in the United States with a correlation coefficient (R) of -0.507 and weighted average of 10.4%. Similarly, the statistical analysis conducted on geographies consisting of 223,315,906 people shows a weak positive correlation between the proportion of Immigrants from Trinidad and Tobago and percentage of households with no vehicle available in the United States with a correlation coefficient (R) of 0.257 and weighted average of 24.6%, a difference of 136.7%.
No Vehicles in Household Correlation Summary
| Measurement | Filipino | Immigrants from Trinidad and Tobago |
| Minimum | 0.54% | 0.21% |
| Maximum | 25.0% | 70.0% |
| Range | 24.5% | 69.8% |
| Mean | 6.8% | 18.1% |
| Median | 5.6% | 13.0% |
| Interquartile 25% (IQ1) | 2.9% | 7.4% |
| Interquartile 75% (IQ3) | 9.0% | 22.0% |
| Interquartile Range (IQR) | 6.1% | 14.6% |
| Standard Deviation (Sample) | 5.1% | 16.0% |
| Standard Deviation (Population) | 5.1% | 15.9% |
Similar Demographics by No Vehicles in Household
Demographics Similar to Filipinos by No Vehicles in Household
In terms of no vehicles in household, the demographic groups most similar to Filipinos are Immigrants from Sudan (10.4%, a difference of 0.010%), Immigrants from Burma/Myanmar (10.4%, a difference of 0.13%), French American Indian (10.4%, a difference of 0.13%), Immigrants from El Salvador (10.4%, a difference of 0.14%), and Brazilian (10.4%, a difference of 0.22%).
| Demographics | Rating | Rank | No Vehicles in Household |
| Immigrants | Costa Rica | 60.5 /100 | #166 | Good 10.3% |
| Immigrants | Saudi Arabia | 58.8 /100 | #167 | Average 10.3% |
| Indonesians | 56.7 /100 | #168 | Average 10.3% |
| Lumbee | 54.7 /100 | #169 | Average 10.3% |
| Immigrants | Latin America | 53.2 /100 | #170 | Average 10.4% |
| Hmong | 52.7 /100 | #171 | Average 10.4% |
| Brazilians | 51.7 /100 | #172 | Average 10.4% |
| Filipinos | 50.1 /100 | #173 | Average 10.4% |
| Immigrants | Sudan | 50.0 /100 | #174 | Average 10.4% |
| Immigrants | Burma/Myanmar | 49.1 /100 | #175 | Average 10.4% |
| French American Indians | 49.1 /100 | #176 | Average 10.4% |
| Immigrants | El Salvador | 49.1 /100 | #177 | Average 10.4% |
| Immigrants | Ethiopia | 48.0 /100 | #178 | Average 10.4% |
| Ethiopians | 45.8 /100 | #179 | Average 10.5% |
| Arabs | 45.3 /100 | #180 | Average 10.5% |
Demographics Similar to Immigrants from Trinidad and Tobago by No Vehicles in Household
In terms of no vehicles in household, the demographic groups most similar to Immigrants from Trinidad and Tobago are Immigrants from Ecuador (23.8%, a difference of 3.4%), Trinidadian and Tobagonian (23.7%, a difference of 3.7%), West Indian (23.7%, a difference of 3.9%), Immigrants from Bangladesh (25.8%, a difference of 4.5%), and Barbadian (26.1%, a difference of 5.9%).
| Demographics | Rating | Rank | No Vehicles in Household |
| Immigrants | West Indies | 0.0 /100 | #326 | Tragic 20.5% |
| Immigrants | Senegal | 0.0 /100 | #327 | Tragic 21.1% |
| Immigrants | Dominica | 0.0 /100 | #328 | Tragic 22.2% |
| Ecuadorians | 0.0 /100 | #329 | Tragic 22.8% |
| West Indians | 0.0 /100 | #330 | Tragic 23.7% |
| Trinidadians and Tobagonians | 0.0 /100 | #331 | Tragic 23.7% |
| Immigrants | Ecuador | 0.0 /100 | #332 | Tragic 23.8% |
| Immigrants | Trinidad and Tobago | 0.0 /100 | #333 | Tragic 24.6% |
| Immigrants | Bangladesh | 0.0 /100 | #334 | Tragic 25.8% |
| Barbadians | 0.0 /100 | #335 | Tragic 26.1% |
| Vietnamese | 0.0 /100 | #336 | Tragic 26.2% |
| Immigrants | Uzbekistan | 0.0 /100 | #337 | Tragic 26.7% |
| Guyanese | 0.0 /100 | #338 | Tragic 29.3% |
| Dominicans | 0.0 /100 | #339 | Tragic 29.4% |
| Immigrants | Barbados | 0.0 /100 | #340 | Tragic 29.5% |