British West Indian vs Senegalese 2 or more Vehicles in Household
COMPARE
British West Indian
Senegalese
2 or more Vehicles in Household
2 or more Vehicles in Household Comparison
British West Indians
Senegalese
35.4%
2 OR MORE VEHICLES IN HOUSEHOLD
0.0/ 100
METRIC RATING
340th/ 347
METRIC RANK
44.2%
2 OR MORE VEHICLES IN HOUSEHOLD
0.0/ 100
METRIC RATING
322nd/ 347
METRIC RANK
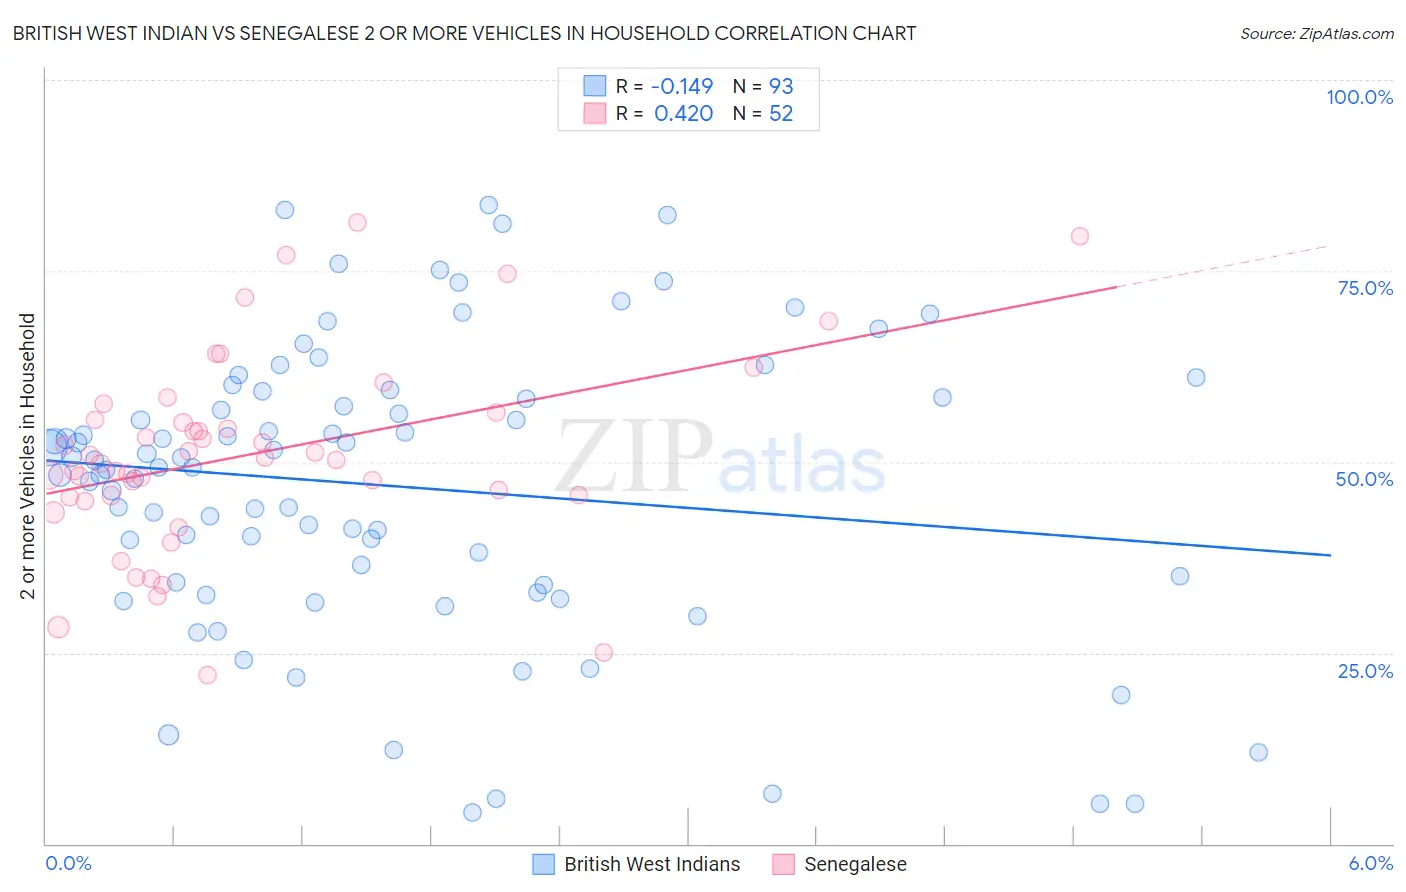
British West Indian vs Senegalese 2 or more Vehicles in Household Correlation Chart
The statistical analysis conducted on geographies consisting of 152,636,759 people shows a poor negative correlation between the proportion of British West Indians and percentage of households with 2 or more vehicles available in the United States with a correlation coefficient (R) of -0.149 and weighted average of 35.4%. Similarly, the statistical analysis conducted on geographies consisting of 78,083,411 people shows a moderate positive correlation between the proportion of Senegalese and percentage of households with 2 or more vehicles available in the United States with a correlation coefficient (R) of 0.420 and weighted average of 44.2%, a difference of 24.9%.
2 or more Vehicles in Household Correlation Summary
| Measurement | British West Indian | Senegalese |
| Minimum | 4.2% | 22.1% |
| Maximum | 83.7% | 81.4% |
| Range | 79.5% | 59.3% |
| Mean | 46.8% | 51.0% |
| Median | 49.3% | 50.3% |
| Interquartile 25% (IQ1) | 34.0% | 45.5% |
| Interquartile 75% (IQ3) | 58.8% | 56.0% |
| Interquartile Range (IQR) | 24.8% | 10.5% |
| Standard Deviation (Sample) | 18.9% | 12.8% |
| Standard Deviation (Population) | 18.8% | 12.7% |
Demographics Similar to British West Indians and Senegalese by 2 or more Vehicles in Household
In terms of 2 or more vehicles in household, the demographic groups most similar to British West Indians are Guyanese (35.4%, a difference of 0.070%), Immigrants from Barbados (35.8%, a difference of 1.1%), Immigrants from Uzbekistan (37.9%, a difference of 7.0%), Barbadian (38.3%, a difference of 8.3%), and Vietnamese (38.5%, a difference of 8.7%). Similarly, the demographic groups most similar to Senegalese are Immigrants from Caribbean (44.2%, a difference of 0.020%), Immigrants from Jamaica (44.5%, a difference of 0.55%), Immigrants from Cabo Verde (43.3%, a difference of 2.1%), Immigrants from West Indies (43.1%, a difference of 2.6%), and Immigrants from Senegal (43.0%, a difference of 2.8%).
| Demographics | Rating | Rank | 2 or more Vehicles in Household |
| Immigrants | Jamaica | 0.0 /100 | #321 | Tragic 44.5% |
| Senegalese | 0.0 /100 | #322 | Tragic 44.2% |
| Immigrants | Caribbean | 0.0 /100 | #323 | Tragic 44.2% |
| Immigrants | Cabo Verde | 0.0 /100 | #324 | Tragic 43.3% |
| Immigrants | West Indies | 0.0 /100 | #325 | Tragic 43.1% |
| Immigrants | Senegal | 0.0 /100 | #326 | Tragic 43.0% |
| Immigrants | Yemen | 0.0 /100 | #327 | Tragic 42.8% |
| Inupiat | 0.0 /100 | #328 | Tragic 42.6% |
| Ecuadorians | 0.0 /100 | #329 | Tragic 42.0% |
| Immigrants | Dominica | 0.0 /100 | #330 | Tragic 41.6% |
| West Indians | 0.0 /100 | #331 | Tragic 41.3% |
| Trinidadians and Tobagonians | 0.0 /100 | #332 | Tragic 40.9% |
| Immigrants | Ecuador | 0.0 /100 | #333 | Tragic 40.5% |
| Immigrants | Trinidad and Tobago | 0.0 /100 | #334 | Tragic 40.3% |
| Immigrants | Bangladesh | 0.0 /100 | #335 | Tragic 38.8% |
| Vietnamese | 0.0 /100 | #336 | Tragic 38.5% |
| Barbadians | 0.0 /100 | #337 | Tragic 38.3% |
| Immigrants | Uzbekistan | 0.0 /100 | #338 | Tragic 37.9% |
| Immigrants | Barbados | 0.0 /100 | #339 | Tragic 35.8% |
| British West Indians | 0.0 /100 | #340 | Tragic 35.4% |
| Guyanese | 0.0 /100 | #341 | Tragic 35.4% |