Basque vs Immigrants from Fiji 2 or more Vehicles in Household
COMPARE
Basque
Immigrants from Fiji
2 or more Vehicles in Household
2 or more Vehicles in Household Comparison
Basques
Immigrants from Fiji
61.4%
2 OR MORE VEHICLES IN HOUSEHOLD
100.0/ 100
METRIC RATING
17th/ 347
METRIC RANK
62.3%
2 OR MORE VEHICLES IN HOUSEHOLD
100.0/ 100
METRIC RATING
5th/ 347
METRIC RANK
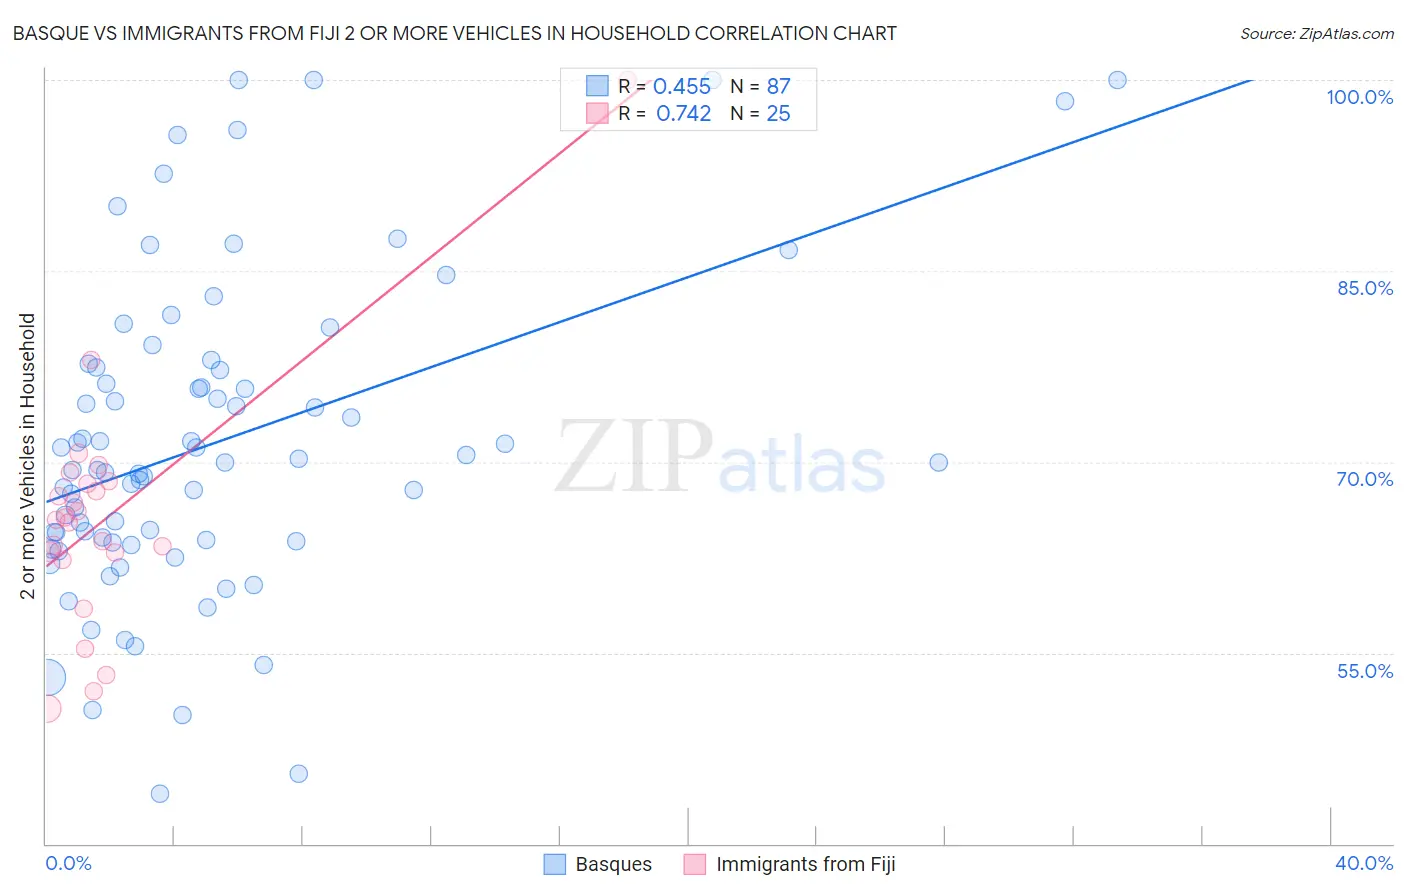
Basque vs Immigrants from Fiji 2 or more Vehicles in Household Correlation Chart
The statistical analysis conducted on geographies consisting of 165,752,763 people shows a moderate positive correlation between the proportion of Basques and percentage of households with 2 or more vehicles available in the United States with a correlation coefficient (R) of 0.455 and weighted average of 61.4%. Similarly, the statistical analysis conducted on geographies consisting of 93,754,900 people shows a strong positive correlation between the proportion of Immigrants from Fiji and percentage of households with 2 or more vehicles available in the United States with a correlation coefficient (R) of 0.742 and weighted average of 62.3%, a difference of 1.5%.
2 or more Vehicles in Household Correlation Summary
| Measurement | Basque | Immigrants from Fiji |
| Minimum | 43.9% | 50.6% |
| Maximum | 100.0% | 100.0% |
| Range | 56.1% | 49.4% |
| Mean | 71.5% | 65.5% |
| Median | 70.0% | 65.5% |
| Interquartile 25% (IQ1) | 63.8% | 62.6% |
| Interquartile 75% (IQ3) | 77.4% | 68.4% |
| Interquartile Range (IQR) | 13.6% | 5.9% |
| Standard Deviation (Sample) | 12.5% | 9.5% |
| Standard Deviation (Population) | 12.4% | 9.3% |
Demographics Similar to Basques and Immigrants from Fiji by 2 or more Vehicles in Household
In terms of 2 or more vehicles in household, the demographic groups most similar to Basques are European (61.4%, a difference of 0.020%), Native Hawaiian (61.4%, a difference of 0.070%), Nepalese (61.4%, a difference of 0.090%), Czech (61.5%, a difference of 0.18%), and Samoan (61.5%, a difference of 0.22%). Similarly, the demographic groups most similar to Immigrants from Fiji are Scandinavian (62.1%, a difference of 0.34%), Puget Sound Salish (62.1%, a difference of 0.40%), English (61.9%, a difference of 0.67%), Swedish (61.8%, a difference of 0.74%), and Norwegian (62.8%, a difference of 0.87%).
| Demographics | Rating | Rank | 2 or more Vehicles in Household |
| Yakama | 100.0 /100 | #1 | Exceptional 64.9% |
| Tongans | 100.0 /100 | #2 | Exceptional 63.5% |
| Danes | 100.0 /100 | #3 | Exceptional 63.3% |
| Norwegians | 100.0 /100 | #4 | Exceptional 62.8% |
| Immigrants | Fiji | 100.0 /100 | #5 | Exceptional 62.3% |
| Scandinavians | 100.0 /100 | #6 | Exceptional 62.1% |
| Puget Sound Salish | 100.0 /100 | #7 | Exceptional 62.1% |
| English | 100.0 /100 | #8 | Exceptional 61.9% |
| Swedes | 100.0 /100 | #9 | Exceptional 61.8% |
| Mexicans | 100.0 /100 | #10 | Exceptional 61.7% |
| Dutch | 100.0 /100 | #11 | Exceptional 61.6% |
| Germans | 100.0 /100 | #12 | Exceptional 61.6% |
| Samoans | 100.0 /100 | #13 | Exceptional 61.5% |
| Czechs | 100.0 /100 | #14 | Exceptional 61.5% |
| Nepalese | 100.0 /100 | #15 | Exceptional 61.4% |
| Native Hawaiians | 100.0 /100 | #16 | Exceptional 61.4% |
| Basques | 100.0 /100 | #17 | Exceptional 61.4% |
| Europeans | 100.0 /100 | #18 | Exceptional 61.4% |
| Scottish | 100.0 /100 | #19 | Exceptional 61.2% |
| Sri Lankans | 100.0 /100 | #20 | Exceptional 61.0% |
| Koreans | 100.0 /100 | #21 | Exceptional 61.0% |