Ecuadorian vs Nigerian In Labor Force | Age 20-24
COMPARE
Ecuadorian
Nigerian
In Labor Force | Age 20-24
In Labor Force | Age 20-24 Comparison
Ecuadorians
Nigerians
72.4%
IN LABOR FORCE | AGE 20-24
0.0/ 100
METRIC RATING
303rd/ 347
METRIC RANK
74.7%
IN LABOR FORCE | AGE 20-24
21.9/ 100
METRIC RATING
200th/ 347
METRIC RANK
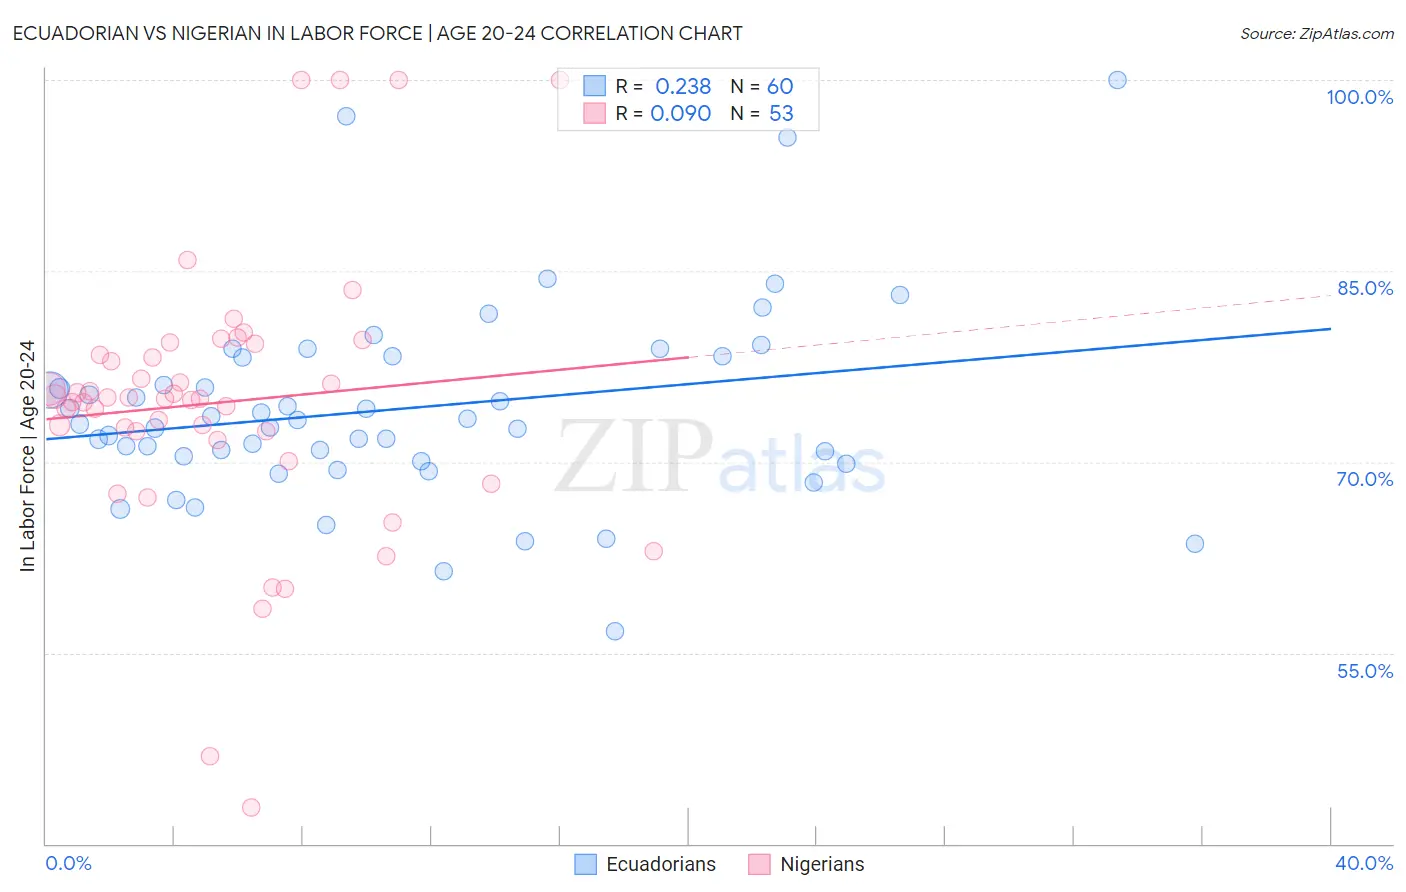
Ecuadorian vs Nigerian In Labor Force | Age 20-24 Correlation Chart
The statistical analysis conducted on geographies consisting of 317,809,827 people shows a weak positive correlation between the proportion of Ecuadorians and labor force participation rate among population between the ages 20 and 24 in the United States with a correlation coefficient (R) of 0.238 and weighted average of 72.4%. Similarly, the statistical analysis conducted on geographies consisting of 332,759,709 people shows a slight positive correlation between the proportion of Nigerians and labor force participation rate among population between the ages 20 and 24 in the United States with a correlation coefficient (R) of 0.090 and weighted average of 74.7%, a difference of 3.2%.
In Labor Force | Age 20-24 Correlation Summary
| Measurement | Ecuadorian | Nigerian |
| Minimum | 56.7% | 42.8% |
| Maximum | 100.0% | 100.0% |
| Range | 43.3% | 57.2% |
| Mean | 74.2% | 74.7% |
| Median | 73.1% | 74.9% |
| Interquartile 25% (IQ1) | 70.2% | 72.1% |
| Interquartile 75% (IQ3) | 78.2% | 78.9% |
| Interquartile Range (IQR) | 8.0% | 6.8% |
| Standard Deviation (Sample) | 7.7% | 10.8% |
| Standard Deviation (Population) | 7.7% | 10.7% |
Similar Demographics by In Labor Force | Age 20-24
Demographics Similar to Ecuadorians by In Labor Force | Age 20-24
In terms of in labor force | age 20-24, the demographic groups most similar to Ecuadorians are Native/Alaskan (72.4%, a difference of 0.010%), Immigrants from West Indies (72.4%, a difference of 0.010%), Immigrants from Singapore (72.4%, a difference of 0.040%), Immigrants from Jamaica (72.4%, a difference of 0.060%), and Cuban (72.5%, a difference of 0.10%).
| Demographics | Rating | Rank | In Labor Force | Age 20-24 |
| Jamaicans | 0.0 /100 | #296 | Tragic 72.7% |
| Central American Indians | 0.0 /100 | #297 | Tragic 72.7% |
| Israelis | 0.0 /100 | #298 | Tragic 72.6% |
| Iranians | 0.0 /100 | #299 | Tragic 72.6% |
| Armenians | 0.0 /100 | #300 | Tragic 72.5% |
| Cubans | 0.0 /100 | #301 | Tragic 72.5% |
| Natives/Alaskans | 0.0 /100 | #302 | Tragic 72.4% |
| Ecuadorians | 0.0 /100 | #303 | Tragic 72.4% |
| Immigrants | West Indies | 0.0 /100 | #304 | Tragic 72.4% |
| Immigrants | Singapore | 0.0 /100 | #305 | Tragic 72.4% |
| Immigrants | Jamaica | 0.0 /100 | #306 | Tragic 72.4% |
| Immigrants | Ecuador | 0.0 /100 | #307 | Tragic 72.3% |
| Soviet Union | 0.0 /100 | #308 | Tragic 72.3% |
| Tsimshian | 0.0 /100 | #309 | Tragic 72.3% |
| Immigrants | Cuba | 0.0 /100 | #310 | Tragic 72.0% |
Demographics Similar to Nigerians by In Labor Force | Age 20-24
In terms of in labor force | age 20-24, the demographic groups most similar to Nigerians are Choctaw (74.7%, a difference of 0.010%), Taiwanese (74.7%, a difference of 0.030%), Moroccan (74.7%, a difference of 0.030%), Immigrants from Nigeria (74.7%, a difference of 0.050%), and Panamanian (74.7%, a difference of 0.060%).
| Demographics | Rating | Rank | In Labor Force | Age 20-24 |
| Alsatians | 27.1 /100 | #193 | Fair 74.8% |
| Immigrants | Denmark | 25.8 /100 | #194 | Fair 74.8% |
| Eastern Europeans | 25.4 /100 | #195 | Fair 74.8% |
| Immigrants | Vietnam | 25.1 /100 | #196 | Fair 74.7% |
| Panamanians | 25.0 /100 | #197 | Fair 74.7% |
| Immigrants | Nigeria | 24.2 /100 | #198 | Fair 74.7% |
| Taiwanese | 23.2 /100 | #199 | Fair 74.7% |
| Nigerians | 21.9 /100 | #200 | Fair 74.7% |
| Choctaw | 21.4 /100 | #201 | Fair 74.7% |
| Moroccans | 20.4 /100 | #202 | Fair 74.7% |
| Immigrants | Northern Africa | 17.9 /100 | #203 | Poor 74.6% |
| Immigrants | Italy | 17.6 /100 | #204 | Poor 74.6% |
| Inupiat | 17.6 /100 | #205 | Poor 74.6% |
| Sioux | 17.5 /100 | #206 | Poor 74.6% |
| Albanians | 16.2 /100 | #207 | Poor 74.6% |