Australian vs Nigerian 3 or more Vehicles in Household
COMPARE
Australian
Nigerian
3 or more Vehicles in Household
3 or more Vehicles in Household Comparison
Australians
Nigerians
20.1%
3 OR MORE VEHICLES IN HOUSEHOLD
83.6/ 100
METRIC RATING
146th/ 347
METRIC RANK
18.6%
3 OR MORE VEHICLES IN HOUSEHOLD
7.9/ 100
METRIC RATING
220th/ 347
METRIC RANK
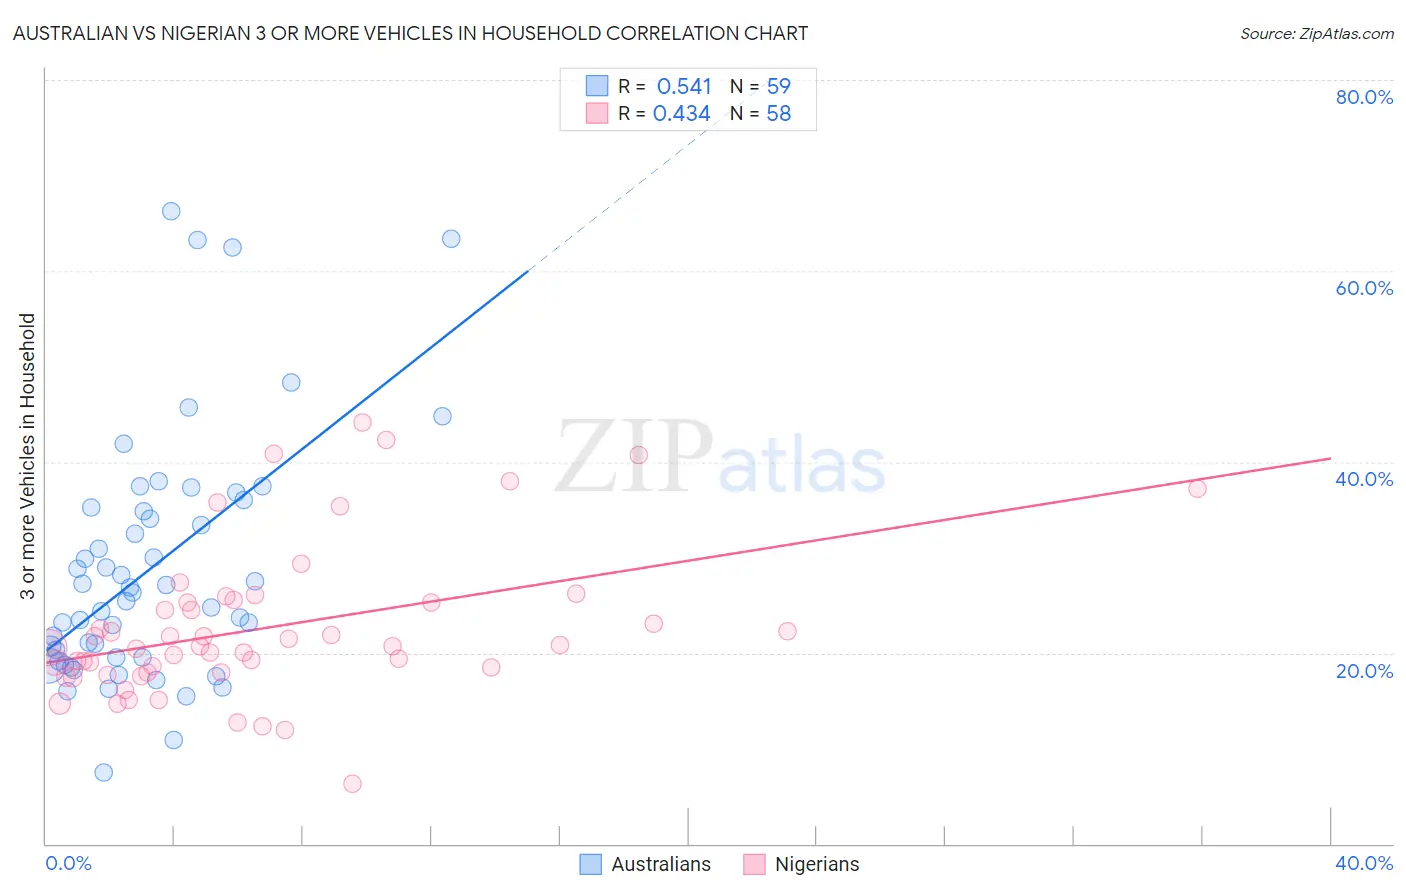
Australian vs Nigerian 3 or more Vehicles in Household Correlation Chart
The statistical analysis conducted on geographies consisting of 223,939,161 people shows a substantial positive correlation between the proportion of Australians and percentage of households with 3 or more vehicles available in the United States with a correlation coefficient (R) of 0.541 and weighted average of 20.1%. Similarly, the statistical analysis conducted on geographies consisting of 332,356,367 people shows a moderate positive correlation between the proportion of Nigerians and percentage of households with 3 or more vehicles available in the United States with a correlation coefficient (R) of 0.434 and weighted average of 18.6%, a difference of 8.1%.
3 or more Vehicles in Household Correlation Summary
| Measurement | Australian | Nigerian |
| Minimum | 7.4% | 6.2% |
| Maximum | 66.2% | 44.2% |
| Range | 58.8% | 37.9% |
| Mean | 28.9% | 22.6% |
| Median | 26.3% | 20.6% |
| Interquartile 25% (IQ1) | 19.5% | 18.0% |
| Interquartile 75% (IQ3) | 35.2% | 25.3% |
| Interquartile Range (IQR) | 15.7% | 7.3% |
| Standard Deviation (Sample) | 12.9% | 7.9% |
| Standard Deviation (Population) | 12.8% | 7.9% |
Similar Demographics by 3 or more Vehicles in Household
Demographics Similar to Australians by 3 or more Vehicles in Household
In terms of 3 or more vehicles in household, the demographic groups most similar to Australians are Palestinian (20.1%, a difference of 0.040%), Iranian (20.1%, a difference of 0.050%), Slovak (20.1%, a difference of 0.080%), Jordanian (20.1%, a difference of 0.11%), and Lithuanian (20.1%, a difference of 0.11%).
| Demographics | Rating | Rank | 3 or more Vehicles in Household |
| Slovenes | 85.5 /100 | #139 | Excellent 20.2% |
| French American Indians | 85.3 /100 | #140 | Excellent 20.1% |
| Ottawa | 84.9 /100 | #141 | Excellent 20.1% |
| Jordanians | 84.4 /100 | #142 | Excellent 20.1% |
| Lithuanians | 84.4 /100 | #143 | Excellent 20.1% |
| Iranians | 84.0 /100 | #144 | Excellent 20.1% |
| Palestinians | 83.9 /100 | #145 | Excellent 20.1% |
| Australians | 83.6 /100 | #146 | Excellent 20.1% |
| Slovaks | 83.0 /100 | #147 | Excellent 20.1% |
| Guatemalans | 82.6 /100 | #148 | Excellent 20.1% |
| Immigrants | Iran | 80.9 /100 | #149 | Excellent 20.0% |
| Immigrants | Immigrants | 80.8 /100 | #150 | Excellent 20.0% |
| Taiwanese | 80.6 /100 | #151 | Excellent 20.0% |
| Lebanese | 79.8 /100 | #152 | Good 20.0% |
| Yuman | 75.6 /100 | #153 | Good 19.9% |
Demographics Similar to Nigerians by 3 or more Vehicles in Household
In terms of 3 or more vehicles in household, the demographic groups most similar to Nigerians are Immigrants from Poland (18.6%, a difference of 0.090%), Belizean (18.6%, a difference of 0.15%), Immigrants from Armenia (18.6%, a difference of 0.20%), Immigrants from Portugal (18.6%, a difference of 0.28%), and Immigrants from Italy (18.7%, a difference of 0.57%).
| Demographics | Rating | Rank | 3 or more Vehicles in Household |
| Immigrants | Cuba | 11.6 /100 | #213 | Poor 18.8% |
| Immigrants | Sierra Leone | 10.8 /100 | #214 | Poor 18.7% |
| Eastern Europeans | 10.6 /100 | #215 | Poor 18.7% |
| Immigrants | Nigeria | 10.3 /100 | #216 | Poor 18.7% |
| Immigrants | Italy | 10.2 /100 | #217 | Poor 18.7% |
| Immigrants | Portugal | 8.9 /100 | #218 | Tragic 18.6% |
| Immigrants | Armenia | 8.6 /100 | #219 | Tragic 18.6% |
| Nigerians | 7.9 /100 | #220 | Tragic 18.6% |
| Immigrants | Poland | 7.5 /100 | #221 | Tragic 18.6% |
| Belizeans | 7.3 /100 | #222 | Tragic 18.6% |
| Immigrants | Czechoslovakia | 5.9 /100 | #223 | Tragic 18.5% |
| Immigrants | Argentina | 5.6 /100 | #224 | Tragic 18.5% |
| Immigrants | Lithuania | 5.6 /100 | #225 | Tragic 18.5% |
| Immigrants | Hungary | 5.5 /100 | #226 | Tragic 18.5% |
| Immigrants | Singapore | 5.4 /100 | #227 | Tragic 18.4% |