Delaware vs Guamanian/Chamorro 5th Grade
COMPARE
Delaware
Guamanian/Chamorro
5th Grade
5th Grade Comparison
Delaware
Guamanians/Chamorros
97.8%
5TH GRADE
98.6/ 100
METRIC RATING
93rd/ 347
METRIC RANK
97.2%
5TH GRADE
26.8/ 100
METRIC RATING
195th/ 347
METRIC RANK
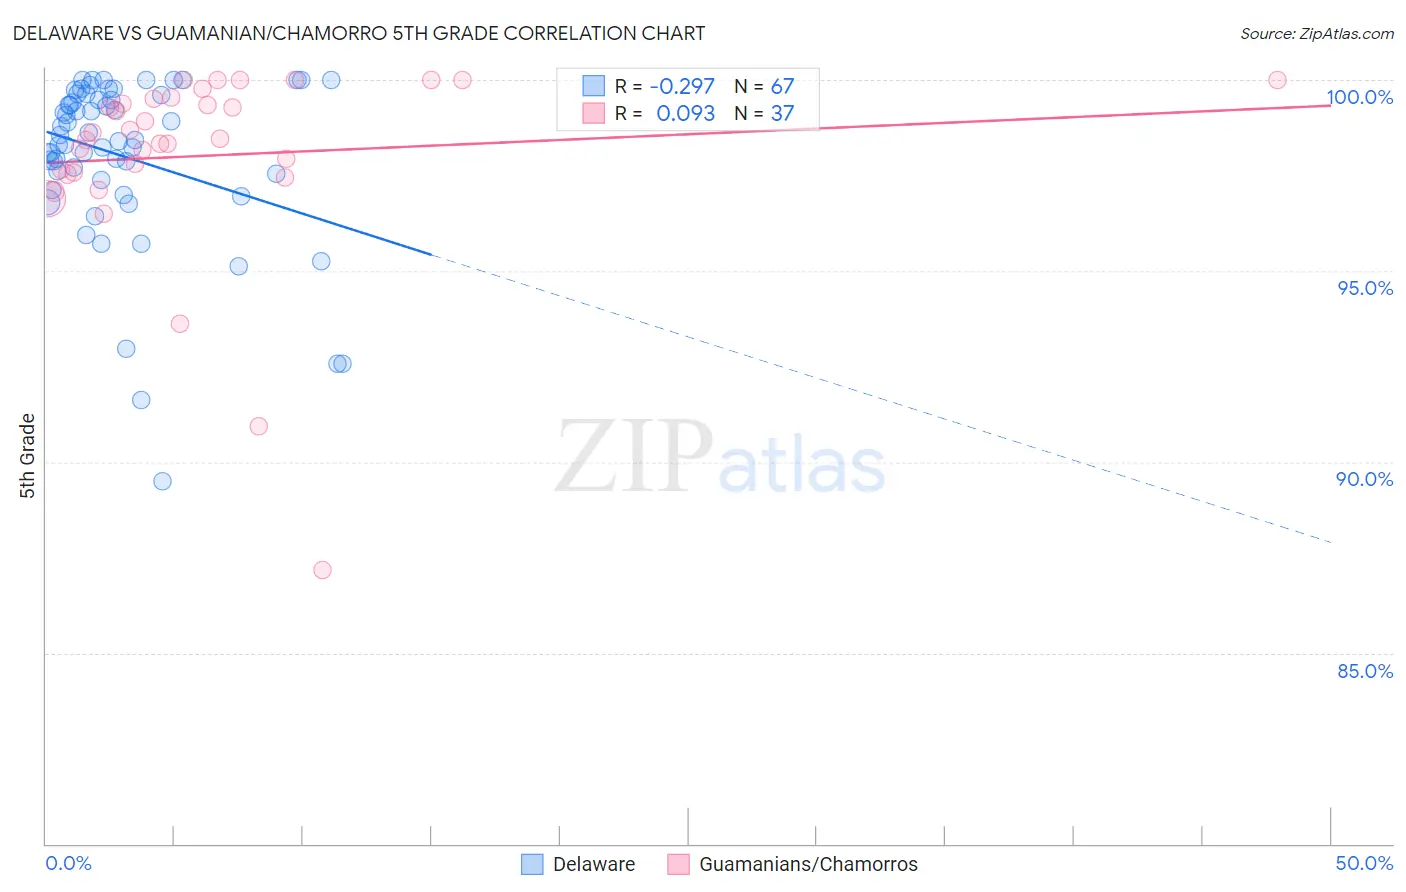
Delaware vs Guamanian/Chamorro 5th Grade Correlation Chart
The statistical analysis conducted on geographies consisting of 96,235,191 people shows a weak negative correlation between the proportion of Delaware and percentage of population with at least 5th grade education in the United States with a correlation coefficient (R) of -0.297 and weighted average of 97.8%. Similarly, the statistical analysis conducted on geographies consisting of 221,965,618 people shows a slight positive correlation between the proportion of Guamanians/Chamorros and percentage of population with at least 5th grade education in the United States with a correlation coefficient (R) of 0.093 and weighted average of 97.2%, a difference of 0.55%.
5th Grade Correlation Summary
| Measurement | Delaware | Guamanian/Chamorro |
| Minimum | 89.5% | 87.2% |
| Maximum | 100.0% | 100.0% |
| Range | 10.5% | 12.8% |
| Mean | 98.0% | 98.0% |
| Median | 98.4% | 98.5% |
| Interquartile 25% (IQ1) | 97.4% | 97.5% |
| Interquartile 75% (IQ3) | 99.6% | 99.5% |
| Interquartile Range (IQR) | 2.2% | 2.0% |
| Standard Deviation (Sample) | 2.2% | 2.6% |
| Standard Deviation (Population) | 2.2% | 2.5% |
Similar Demographics by 5th Grade
Demographics Similar to Delaware by 5th Grade
In terms of 5th grade, the demographic groups most similar to Delaware are Immigrants from Denmark (97.8%, a difference of 0.0%), Immigrants from South Africa (97.8%, a difference of 0.010%), Immigrants from Ireland (97.8%, a difference of 0.010%), Immigrants from Western Europe (97.8%, a difference of 0.010%), and Immigrants from Sweden (97.8%, a difference of 0.010%).
| Demographics | Rating | Rank | 5th Grade |
| Cypriots | 98.9 /100 | #86 | Exceptional 97.8% |
| Immigrants | Australia | 98.8 /100 | #87 | Exceptional 97.8% |
| Shoshone | 98.8 /100 | #88 | Exceptional 97.8% |
| Immigrants | South Africa | 98.8 /100 | #89 | Exceptional 97.8% |
| Immigrants | Ireland | 98.8 /100 | #90 | Exceptional 97.8% |
| Immigrants | Western Europe | 98.8 /100 | #91 | Exceptional 97.8% |
| Immigrants | Sweden | 98.7 /100 | #92 | Exceptional 97.8% |
| Delaware | 98.6 /100 | #93 | Exceptional 97.8% |
| Immigrants | Denmark | 98.6 /100 | #94 | Exceptional 97.8% |
| Romanians | 98.6 /100 | #95 | Exceptional 97.8% |
| Immigrants | Germany | 98.5 /100 | #96 | Exceptional 97.8% |
| Cree | 98.4 /100 | #97 | Exceptional 97.7% |
| Yugoslavians | 98.3 /100 | #98 | Exceptional 97.7% |
| Turks | 98.3 /100 | #99 | Exceptional 97.7% |
| Puget Sound Salish | 98.3 /100 | #100 | Exceptional 97.7% |
Demographics Similar to Guamanians/Chamorros by 5th Grade
In terms of 5th grade, the demographic groups most similar to Guamanians/Chamorros are Navajo (97.2%, a difference of 0.010%), Immigrants from Albania (97.2%, a difference of 0.010%), Hawaiian (97.2%, a difference of 0.010%), Brazilian (97.2%, a difference of 0.010%), and Immigrants from Brazil (97.3%, a difference of 0.020%).
| Demographics | Rating | Rank | 5th Grade |
| Paraguayans | 33.7 /100 | #188 | Fair 97.3% |
| Immigrants | Egypt | 32.9 /100 | #189 | Fair 97.3% |
| Blacks/African Americans | 31.8 /100 | #190 | Fair 97.3% |
| Immigrants | Brazil | 31.5 /100 | #191 | Fair 97.3% |
| Panamanians | 31.3 /100 | #192 | Fair 97.3% |
| Navajo | 29.0 /100 | #193 | Fair 97.2% |
| Immigrants | Albania | 28.5 /100 | #194 | Fair 97.2% |
| Guamanians/Chamorros | 26.8 /100 | #195 | Fair 97.2% |
| Hawaiians | 25.6 /100 | #196 | Fair 97.2% |
| Brazilians | 25.4 /100 | #197 | Fair 97.2% |
| Immigrants | Uganda | 21.1 /100 | #198 | Fair 97.2% |
| Natives/Alaskans | 18.0 /100 | #199 | Poor 97.2% |
| Immigrants | Northern Africa | 16.8 /100 | #200 | Poor 97.2% |
| Immigrants | Chile | 16.6 /100 | #201 | Poor 97.2% |
| Africans | 15.3 /100 | #202 | Poor 97.2% |