Cuban vs Serbian Householder Income Under 25 years
COMPARE
Cuban
Serbian
Householder Income Under 25 years
Householder Income Under 25 years Comparison
Cubans
Serbians
$50,655
HOUSEHOLDER INCOME UNDER 25 YEARS
2.3/ 100
METRIC RATING
242nd/ 347
METRIC RANK
$51,106
HOUSEHOLDER INCOME UNDER 25 YEARS
6.6/ 100
METRIC RATING
223rd/ 347
METRIC RANK
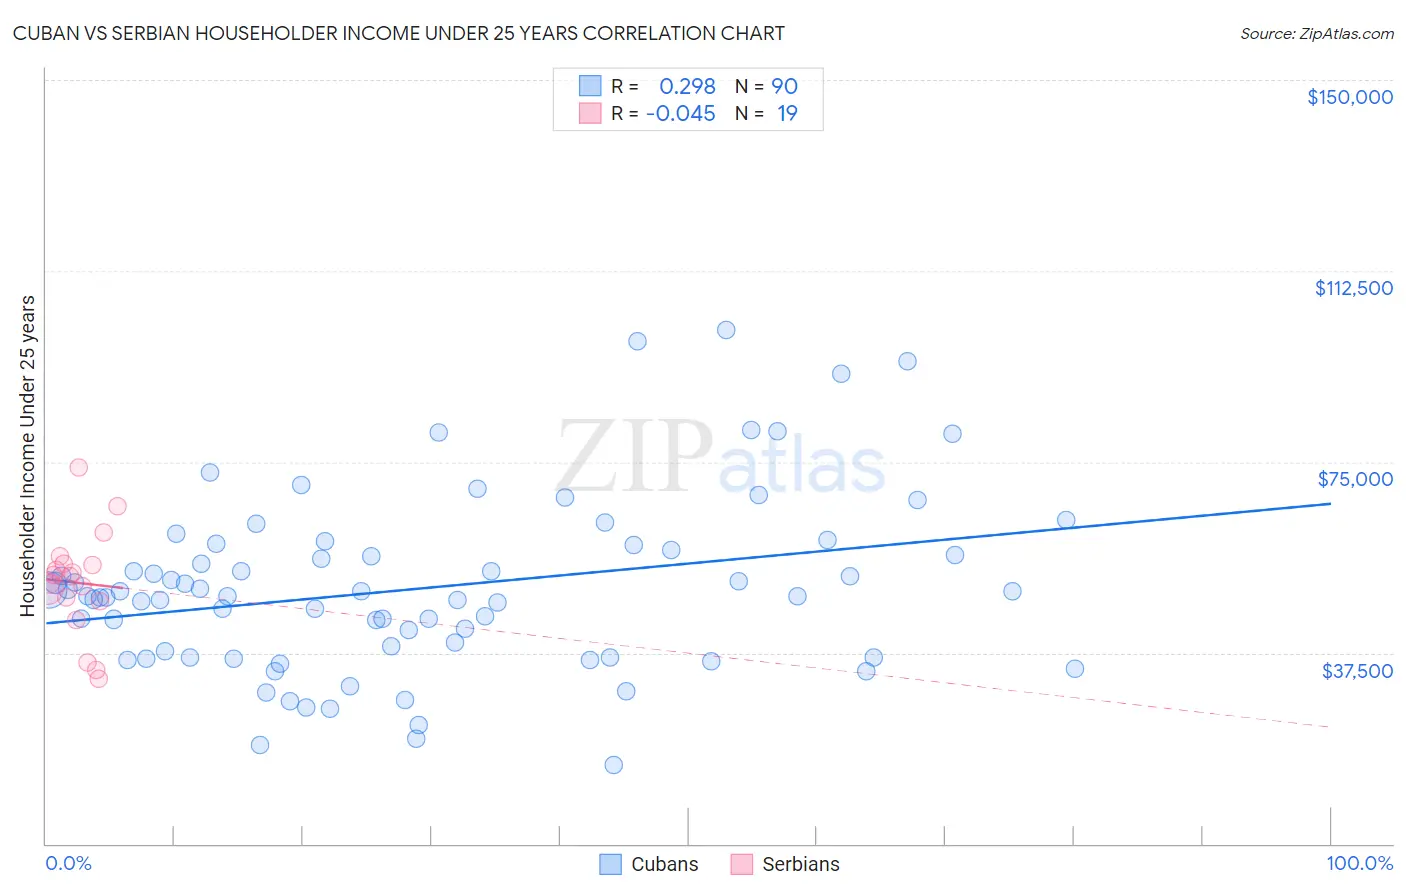
Cuban vs Serbian Householder Income Under 25 years Correlation Chart
The statistical analysis conducted on geographies consisting of 372,353,328 people shows a weak positive correlation between the proportion of Cubans and household income with householder under the age of 25 in the United States with a correlation coefficient (R) of 0.298 and weighted average of $50,655. Similarly, the statistical analysis conducted on geographies consisting of 234,162,574 people shows no correlation between the proportion of Serbians and household income with householder under the age of 25 in the United States with a correlation coefficient (R) of -0.045 and weighted average of $51,106, a difference of 0.89%.
Householder Income Under 25 years Correlation Summary
| Measurement | Cuban | Serbian |
| Minimum | $15,559 | $32,457 |
| Maximum | $100,948 | $73,900 |
| Range | $85,389 | $41,443 |
| Mean | $50,192 | $51,259 |
| Median | $48,589 | $52,630 |
| Interquartile 25% (IQ1) | $36,667 | $47,697 |
| Interquartile 75% (IQ3) | $57,791 | $55,074 |
| Interquartile Range (IQR) | $21,124 | $7,377 |
| Standard Deviation (Sample) | $17,185 | $10,210 |
| Standard Deviation (Population) | $17,090 | $9,937 |
Demographics Similar to Cubans and Serbians by Householder Income Under 25 years
In terms of householder income under 25 years, the demographic groups most similar to Cubans are Immigrants from Micronesia ($50,691, a difference of 0.070%), Immigrants from Lebanon ($50,729, a difference of 0.15%), Immigrants from Caribbean ($50,757, a difference of 0.20%), English ($50,805, a difference of 0.29%), and German ($50,804, a difference of 0.29%). Similarly, the demographic groups most similar to Serbians are Spaniard ($51,117, a difference of 0.020%), Belizean ($51,094, a difference of 0.020%), Immigrants from Jamaica ($51,038, a difference of 0.13%), Yugoslavian ($51,028, a difference of 0.15%), and Immigrants from Central America ($51,022, a difference of 0.16%).
| Demographics | Rating | Rank | Householder Income Under 25 years |
| Spaniards | 6.8 /100 | #222 | Tragic $51,117 |
| Serbians | 6.6 /100 | #223 | Tragic $51,106 |
| Belizeans | 6.4 /100 | #224 | Tragic $51,094 |
| Immigrants | Jamaica | 5.6 /100 | #225 | Tragic $51,038 |
| Yugoslavians | 5.5 /100 | #226 | Tragic $51,028 |
| Immigrants | Central America | 5.4 /100 | #227 | Tragic $51,022 |
| Immigrants | Norway | 5.0 /100 | #228 | Tragic $50,984 |
| Yuman | 4.4 /100 | #229 | Tragic $50,933 |
| Jamaicans | 4.4 /100 | #230 | Tragic $50,929 |
| Ugandans | 4.3 /100 | #231 | Tragic $50,923 |
| Slovenes | 4.0 /100 | #232 | Tragic $50,886 |
| Pennsylvania Germans | 3.7 /100 | #233 | Tragic $50,852 |
| Kenyans | 3.3 /100 | #234 | Tragic $50,815 |
| Spanish | 3.3 /100 | #235 | Tragic $50,813 |
| English | 3.3 /100 | #236 | Tragic $50,805 |
| Germans | 3.3 /100 | #237 | Tragic $50,804 |
| Iraqis | 3.2 /100 | #238 | Tragic $50,802 |
| Immigrants | Caribbean | 2.9 /100 | #239 | Tragic $50,757 |
| Immigrants | Lebanon | 2.7 /100 | #240 | Tragic $50,729 |
| Immigrants | Micronesia | 2.5 /100 | #241 | Tragic $50,691 |
| Cubans | 2.3 /100 | #242 | Tragic $50,655 |