Costa Rican vs Estonian No Vehicles in Household
COMPARE
Costa Rican
Estonian
No Vehicles in Household
No Vehicles in Household Comparison
Costa Ricans
Estonians
9.5%
NO VEHICLES IN HOUSEHOLD
92.3/ 100
METRIC RATING
122nd/ 347
METRIC RANK
9.8%
NO VEHICLES IN HOUSEHOLD
84.2/ 100
METRIC RATING
138th/ 347
METRIC RANK
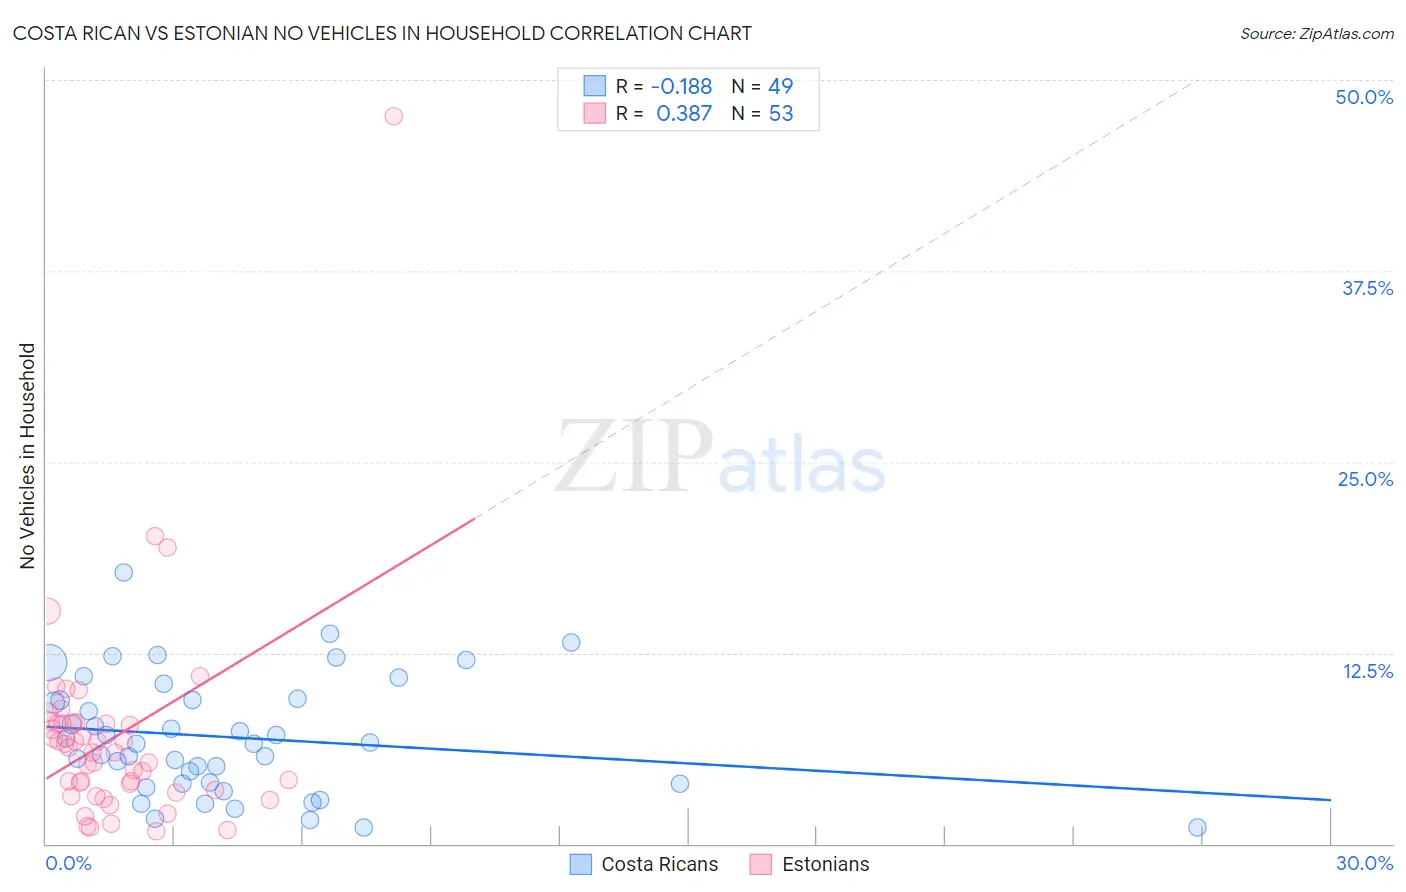
Costa Rican vs Estonian No Vehicles in Household Correlation Chart
The statistical analysis conducted on geographies consisting of 253,314,745 people shows a poor negative correlation between the proportion of Costa Ricans and percentage of households with no vehicle available in the United States with a correlation coefficient (R) of -0.188 and weighted average of 9.5%. Similarly, the statistical analysis conducted on geographies consisting of 123,433,435 people shows a mild positive correlation between the proportion of Estonians and percentage of households with no vehicle available in the United States with a correlation coefficient (R) of 0.387 and weighted average of 9.8%, a difference of 3.0%.
No Vehicles in Household Correlation Summary
| Measurement | Costa Rican | Estonian |
| Minimum | 1.0% | 0.84% |
| Maximum | 17.8% | 47.6% |
| Range | 16.7% | 46.8% |
| Mean | 7.0% | 7.0% |
| Median | 6.6% | 6.0% |
| Interquartile 25% (IQ1) | 3.9% | 3.4% |
| Interquartile 75% (IQ3) | 9.4% | 7.9% |
| Interquartile Range (IQR) | 5.5% | 4.5% |
| Standard Deviation (Sample) | 3.8% | 7.0% |
| Standard Deviation (Population) | 3.8% | 6.9% |
Demographics Similar to Costa Ricans and Estonians by No Vehicles in Household
In terms of no vehicles in household, the demographic groups most similar to Costa Ricans are Puget Sound Salish (9.5%, a difference of 0.050%), Immigrants from Thailand (9.5%, a difference of 0.15%), Blackfeet (9.6%, a difference of 0.46%), Immigrants from Korea (9.6%, a difference of 0.68%), and Immigrants from Cameroon (9.6%, a difference of 0.82%). Similarly, the demographic groups most similar to Estonians are Marshallese (9.8%, a difference of 0.050%), Immigrants from Lithuania (9.8%, a difference of 0.060%), Immigrants from Moldova (9.8%, a difference of 0.12%), Immigrants from South Africa (9.8%, a difference of 0.21%), and Latvian (9.8%, a difference of 0.27%).
| Demographics | Rating | Rank | No Vehicles in Household |
| Immigrants | Thailand | 92.6 /100 | #120 | Exceptional 9.5% |
| Puget Sound Salish | 92.4 /100 | #121 | Exceptional 9.5% |
| Costa Ricans | 92.3 /100 | #122 | Exceptional 9.5% |
| Blackfeet | 91.4 /100 | #123 | Exceptional 9.6% |
| Immigrants | Korea | 90.9 /100 | #124 | Exceptional 9.6% |
| Immigrants | Cameroon | 90.6 /100 | #125 | Exceptional 9.6% |
| Icelanders | 90.2 /100 | #126 | Exceptional 9.6% |
| Immigrants | Kenya | 89.7 /100 | #127 | Excellent 9.6% |
| Immigrants | Syria | 89.5 /100 | #128 | Excellent 9.6% |
| Nicaraguans | 89.5 /100 | #129 | Excellent 9.7% |
| Burmese | 88.8 /100 | #130 | Excellent 9.7% |
| Immigrants | Azores | 88.2 /100 | #131 | Excellent 9.7% |
| Kenyans | 88.0 /100 | #132 | Excellent 9.7% |
| Immigrants | Oceania | 87.1 /100 | #133 | Excellent 9.7% |
| Syrians | 87.1 /100 | #134 | Excellent 9.7% |
| Latvians | 85.1 /100 | #135 | Excellent 9.8% |
| Immigrants | South Africa | 85.0 /100 | #136 | Excellent 9.8% |
| Immigrants | Moldova | 84.6 /100 | #137 | Excellent 9.8% |
| Estonians | 84.2 /100 | #138 | Excellent 9.8% |
| Marshallese | 84.0 /100 | #139 | Excellent 9.8% |
| Immigrants | Lithuania | 84.0 /100 | #140 | Excellent 9.8% |