Costa Rican vs Immigrants from Zimbabwe Child Poverty Among Boys Under 16
COMPARE
Costa Rican
Immigrants from Zimbabwe
Child Poverty Among Boys Under 16
Child Poverty Among Boys Under 16 Comparison
Costa Ricans
Immigrants from Zimbabwe
16.1%
CHILD POVERTY AMONG BOYS UNDER 16
68.1/ 100
METRIC RATING
163rd/ 347
METRIC RANK
15.2%
CHILD POVERTY AMONG BOYS UNDER 16
94.2/ 100
METRIC RATING
111th/ 347
METRIC RANK
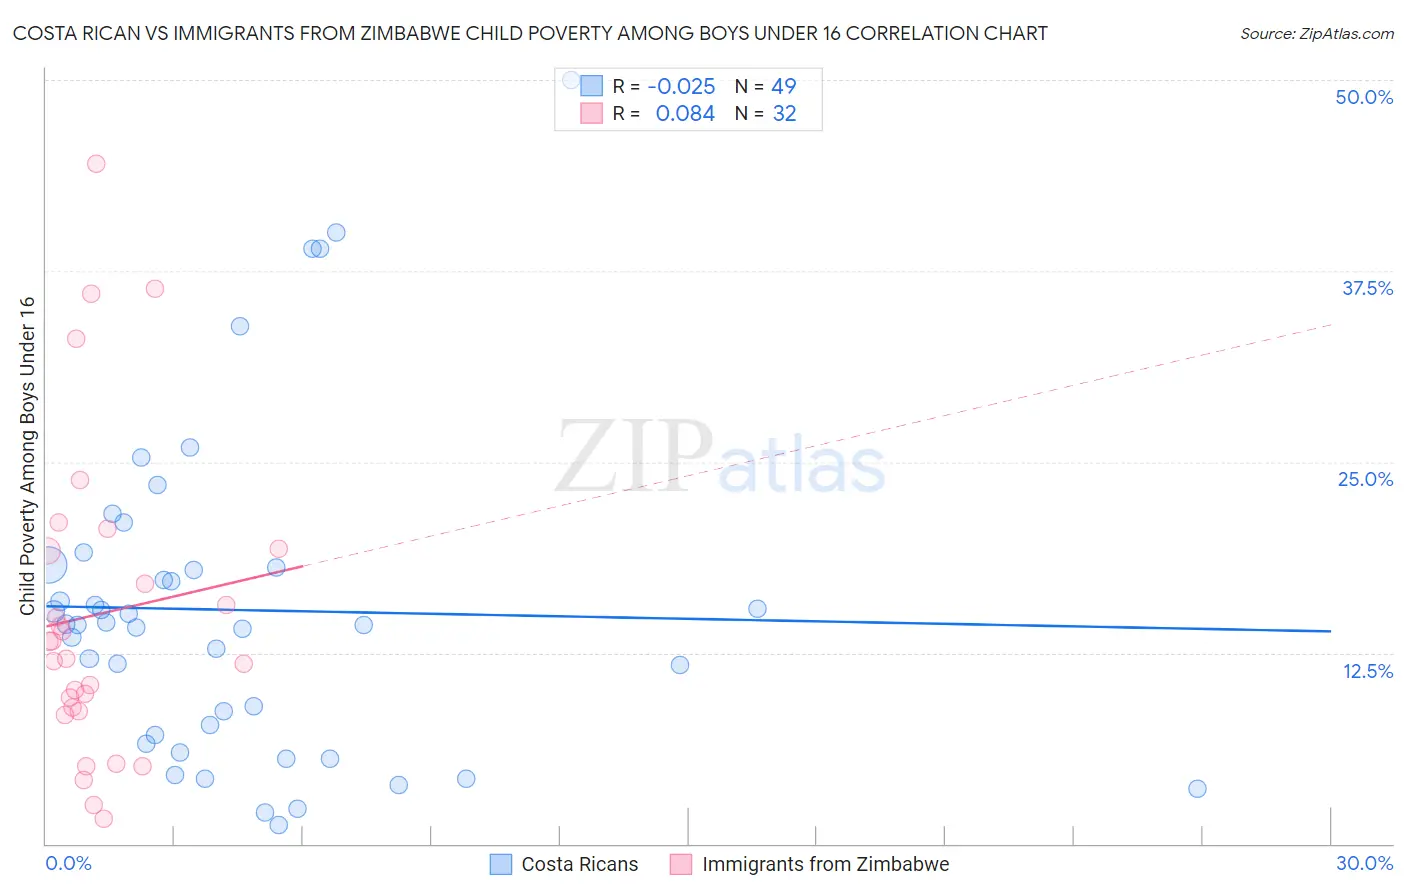
Costa Rican vs Immigrants from Zimbabwe Child Poverty Among Boys Under 16 Correlation Chart
The statistical analysis conducted on geographies consisting of 251,285,350 people shows no correlation between the proportion of Costa Ricans and poverty level among boys under the age of 16 in the United States with a correlation coefficient (R) of -0.025 and weighted average of 16.1%. Similarly, the statistical analysis conducted on geographies consisting of 117,351,792 people shows a slight positive correlation between the proportion of Immigrants from Zimbabwe and poverty level among boys under the age of 16 in the United States with a correlation coefficient (R) of 0.084 and weighted average of 15.2%, a difference of 6.1%.
Child Poverty Among Boys Under 16 Correlation Summary
| Measurement | Costa Rican | Immigrants from Zimbabwe |
| Minimum | 1.2% | 1.6% |
| Maximum | 50.0% | 44.5% |
| Range | 48.8% | 42.9% |
| Mean | 15.3% | 15.0% |
| Median | 14.3% | 12.7% |
| Interquartile 25% (IQ1) | 6.9% | 8.8% |
| Interquartile 75% (IQ3) | 18.2% | 19.2% |
| Interquartile Range (IQR) | 11.3% | 10.4% |
| Standard Deviation (Sample) | 10.7% | 10.3% |
| Standard Deviation (Population) | 10.6% | 10.1% |
Similar Demographics by Child Poverty Among Boys Under 16
Demographics Similar to Costa Ricans by Child Poverty Among Boys Under 16
In terms of child poverty among boys under 16, the demographic groups most similar to Costa Ricans are Immigrants from Albania (16.1%, a difference of 0.020%), Guamanian/Chamorro (16.1%, a difference of 0.20%), Colombian (16.1%, a difference of 0.38%), Immigrants from Oceania (16.0%, a difference of 0.43%), and Immigrants from Northern Africa (16.0%, a difference of 0.44%).
| Demographics | Rating | Rank | Child Poverty Among Boys Under 16 |
| Israelis | 76.5 /100 | #156 | Good 15.9% |
| Immigrants | Nepal | 76.0 /100 | #157 | Good 15.9% |
| Yugoslavians | 75.9 /100 | #158 | Good 15.9% |
| Immigrants | Chile | 74.8 /100 | #159 | Good 15.9% |
| Immigrants | Northern Africa | 71.3 /100 | #160 | Good 16.0% |
| Immigrants | Oceania | 71.3 /100 | #161 | Good 16.0% |
| Guamanians/Chamorros | 69.6 /100 | #162 | Good 16.1% |
| Costa Ricans | 68.1 /100 | #163 | Good 16.1% |
| Immigrants | Albania | 67.9 /100 | #164 | Good 16.1% |
| Colombians | 65.2 /100 | #165 | Good 16.1% |
| Immigrants | Germany | 63.6 /100 | #166 | Good 16.2% |
| Afghans | 55.4 /100 | #167 | Average 16.3% |
| South Americans | 55.3 /100 | #168 | Average 16.3% |
| Immigrants | Saudi Arabia | 53.6 /100 | #169 | Average 16.4% |
| Immigrants | Bosnia and Herzegovina | 51.7 /100 | #170 | Average 16.4% |
Demographics Similar to Immigrants from Zimbabwe by Child Poverty Among Boys Under 16
In terms of child poverty among boys under 16, the demographic groups most similar to Immigrants from Zimbabwe are English (15.1%, a difference of 0.050%), Basque (15.2%, a difference of 0.20%), Irish (15.2%, a difference of 0.24%), Immigrants from Ukraine (15.2%, a difference of 0.29%), and Pakistani (15.1%, a difference of 0.31%).
| Demographics | Rating | Rank | Child Poverty Among Boys Under 16 |
| Immigrants | Switzerland | 95.4 /100 | #104 | Exceptional 15.0% |
| Dutch | 95.4 /100 | #105 | Exceptional 15.0% |
| Serbians | 95.2 /100 | #106 | Exceptional 15.1% |
| Jordanians | 95.1 /100 | #107 | Exceptional 15.1% |
| Immigrants | England | 94.8 /100 | #108 | Exceptional 15.1% |
| Pakistanis | 94.7 /100 | #109 | Exceptional 15.1% |
| English | 94.3 /100 | #110 | Exceptional 15.1% |
| Immigrants | Zimbabwe | 94.2 /100 | #111 | Exceptional 15.2% |
| Basques | 93.8 /100 | #112 | Exceptional 15.2% |
| Irish | 93.8 /100 | #113 | Exceptional 15.2% |
| Immigrants | Ukraine | 93.6 /100 | #114 | Exceptional 15.2% |
| Armenians | 93.6 /100 | #115 | Exceptional 15.2% |
| Immigrants | South Eastern Asia | 93.5 /100 | #116 | Exceptional 15.2% |
| Immigrants | Vietnam | 93.5 /100 | #117 | Exceptional 15.2% |
| Native Hawaiians | 93.4 /100 | #118 | Exceptional 15.2% |