Costa Rican vs Chinese No Vehicles in Household
COMPARE
Costa Rican
Chinese
No Vehicles in Household
No Vehicles in Household Comparison
Costa Ricans
Chinese
9.5%
NO VEHICLES IN HOUSEHOLD
92.3/ 100
METRIC RATING
122nd/ 347
METRIC RANK
8.2%
NO VEHICLES IN HOUSEHOLD
99.8/ 100
METRIC RATING
62nd/ 347
METRIC RANK
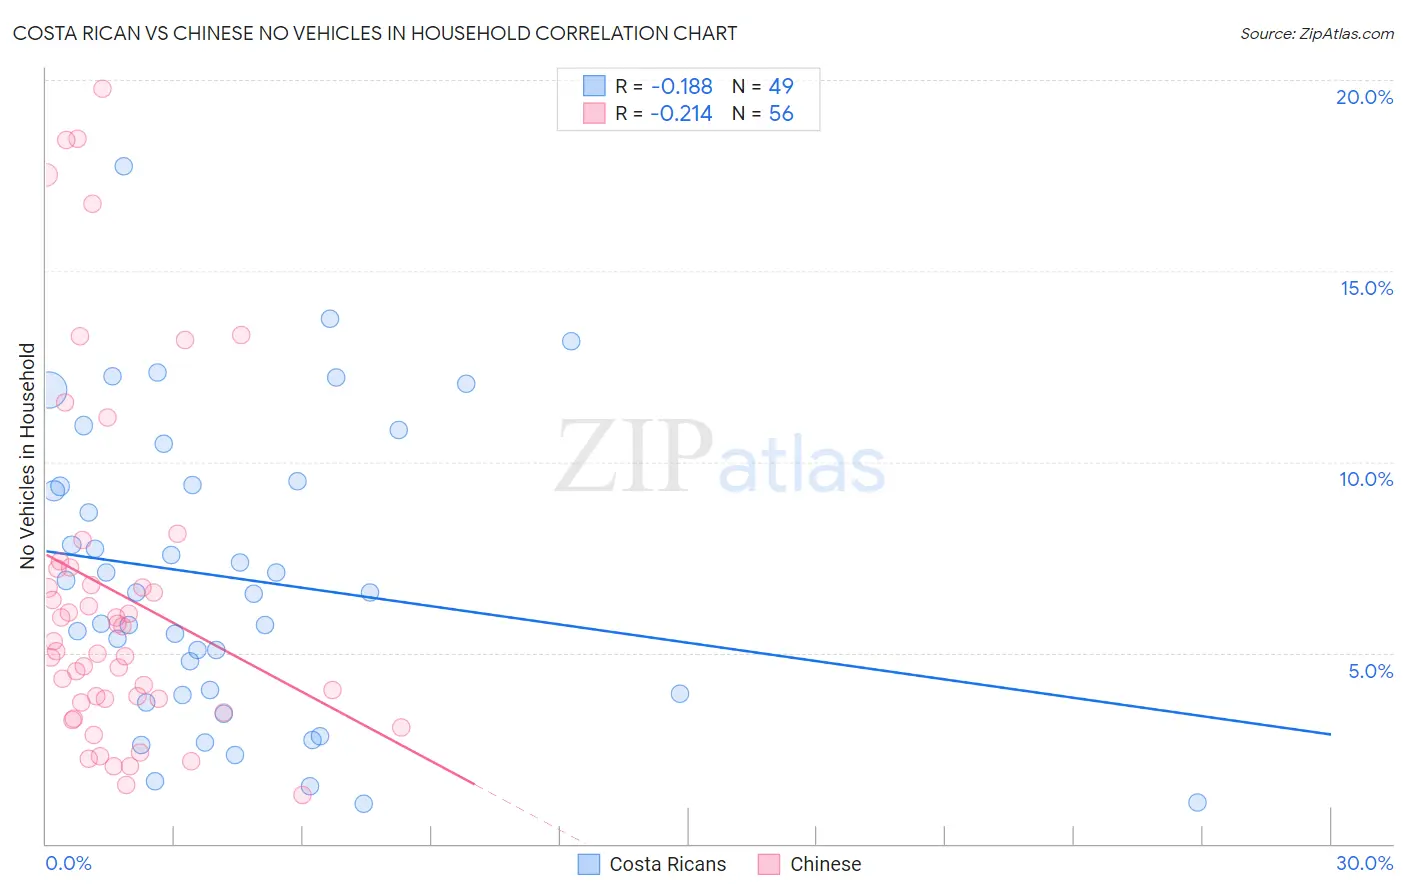
Costa Rican vs Chinese No Vehicles in Household Correlation Chart
The statistical analysis conducted on geographies consisting of 253,314,745 people shows a poor negative correlation between the proportion of Costa Ricans and percentage of households with no vehicle available in the United States with a correlation coefficient (R) of -0.188 and weighted average of 9.5%. Similarly, the statistical analysis conducted on geographies consisting of 64,763,306 people shows a weak negative correlation between the proportion of Chinese and percentage of households with no vehicle available in the United States with a correlation coefficient (R) of -0.214 and weighted average of 8.2%, a difference of 15.9%.
No Vehicles in Household Correlation Summary
| Measurement | Costa Rican | Chinese |
| Minimum | 1.0% | 1.3% |
| Maximum | 17.8% | 19.8% |
| Range | 16.7% | 18.5% |
| Mean | 7.0% | 6.6% |
| Median | 6.6% | 5.2% |
| Interquartile 25% (IQ1) | 3.9% | 3.7% |
| Interquartile 75% (IQ3) | 9.4% | 7.2% |
| Interquartile Range (IQR) | 5.5% | 3.5% |
| Standard Deviation (Sample) | 3.8% | 4.6% |
| Standard Deviation (Population) | 3.8% | 4.6% |
Similar Demographics by No Vehicles in Household
Demographics Similar to Costa Ricans by No Vehicles in Household
In terms of no vehicles in household, the demographic groups most similar to Costa Ricans are Puget Sound Salish (9.5%, a difference of 0.050%), Immigrants from Thailand (9.5%, a difference of 0.15%), Fijian (9.5%, a difference of 0.21%), Greek (9.5%, a difference of 0.32%), and Blackfeet (9.6%, a difference of 0.46%).
| Demographics | Rating | Rank | No Vehicles in Household |
| Navajo | 94.2 /100 | #115 | Exceptional 9.4% |
| Japanese | 94.1 /100 | #116 | Exceptional 9.4% |
| Chippewa | 93.8 /100 | #117 | Exceptional 9.4% |
| Greeks | 92.9 /100 | #118 | Exceptional 9.5% |
| Fijians | 92.7 /100 | #119 | Exceptional 9.5% |
| Immigrants | Thailand | 92.6 /100 | #120 | Exceptional 9.5% |
| Puget Sound Salish | 92.4 /100 | #121 | Exceptional 9.5% |
| Costa Ricans | 92.3 /100 | #122 | Exceptional 9.5% |
| Blackfeet | 91.4 /100 | #123 | Exceptional 9.6% |
| Immigrants | Korea | 90.9 /100 | #124 | Exceptional 9.6% |
| Immigrants | Cameroon | 90.6 /100 | #125 | Exceptional 9.6% |
| Icelanders | 90.2 /100 | #126 | Exceptional 9.6% |
| Immigrants | Kenya | 89.7 /100 | #127 | Excellent 9.6% |
| Immigrants | Syria | 89.5 /100 | #128 | Excellent 9.6% |
| Nicaraguans | 89.5 /100 | #129 | Excellent 9.7% |
Demographics Similar to Chinese by No Vehicles in Household
In terms of no vehicles in household, the demographic groups most similar to Chinese are Slovak (8.3%, a difference of 0.38%), Thai (8.2%, a difference of 0.46%), Croatian (8.3%, a difference of 0.47%), Immigrants from Laos (8.2%, a difference of 0.62%), and Immigrants from India (8.2%, a difference of 0.69%).
| Demographics | Rating | Rank | No Vehicles in Household |
| Celtics | 99.9 /100 | #55 | Exceptional 8.1% |
| Immigrants | Afghanistan | 99.9 /100 | #56 | Exceptional 8.1% |
| Venezuelans | 99.8 /100 | #57 | Exceptional 8.1% |
| Immigrants | Mexico | 99.8 /100 | #58 | Exceptional 8.1% |
| Immigrants | India | 99.8 /100 | #59 | Exceptional 8.2% |
| Immigrants | Laos | 99.8 /100 | #60 | Exceptional 8.2% |
| Thais | 99.8 /100 | #61 | Exceptional 8.2% |
| Chinese | 99.8 /100 | #62 | Exceptional 8.2% |
| Slovaks | 99.8 /100 | #63 | Exceptional 8.3% |
| Croatians | 99.8 /100 | #64 | Exceptional 8.3% |
| Canadians | 99.7 /100 | #65 | Exceptional 8.3% |
| Palestinians | 99.7 /100 | #66 | Exceptional 8.3% |
| Immigrants | Scotland | 99.7 /100 | #67 | Exceptional 8.3% |
| Immigrants | Iran | 99.7 /100 | #68 | Exceptional 8.4% |
| Spaniards | 99.7 /100 | #69 | Exceptional 8.4% |