Costa Rican vs Estonian Disability Age 35 to 64
COMPARE
Costa Rican
Estonian
Disability Age 35 to 64
Disability Age 35 to 64 Comparison
Costa Ricans
Estonians
10.7%
DISABILITY AGE 35 TO 64
91.4/ 100
METRIC RATING
139th/ 347
METRIC RANK
10.6%
DISABILITY AGE 35 TO 64
94.5/ 100
METRIC RATING
124th/ 347
METRIC RANK
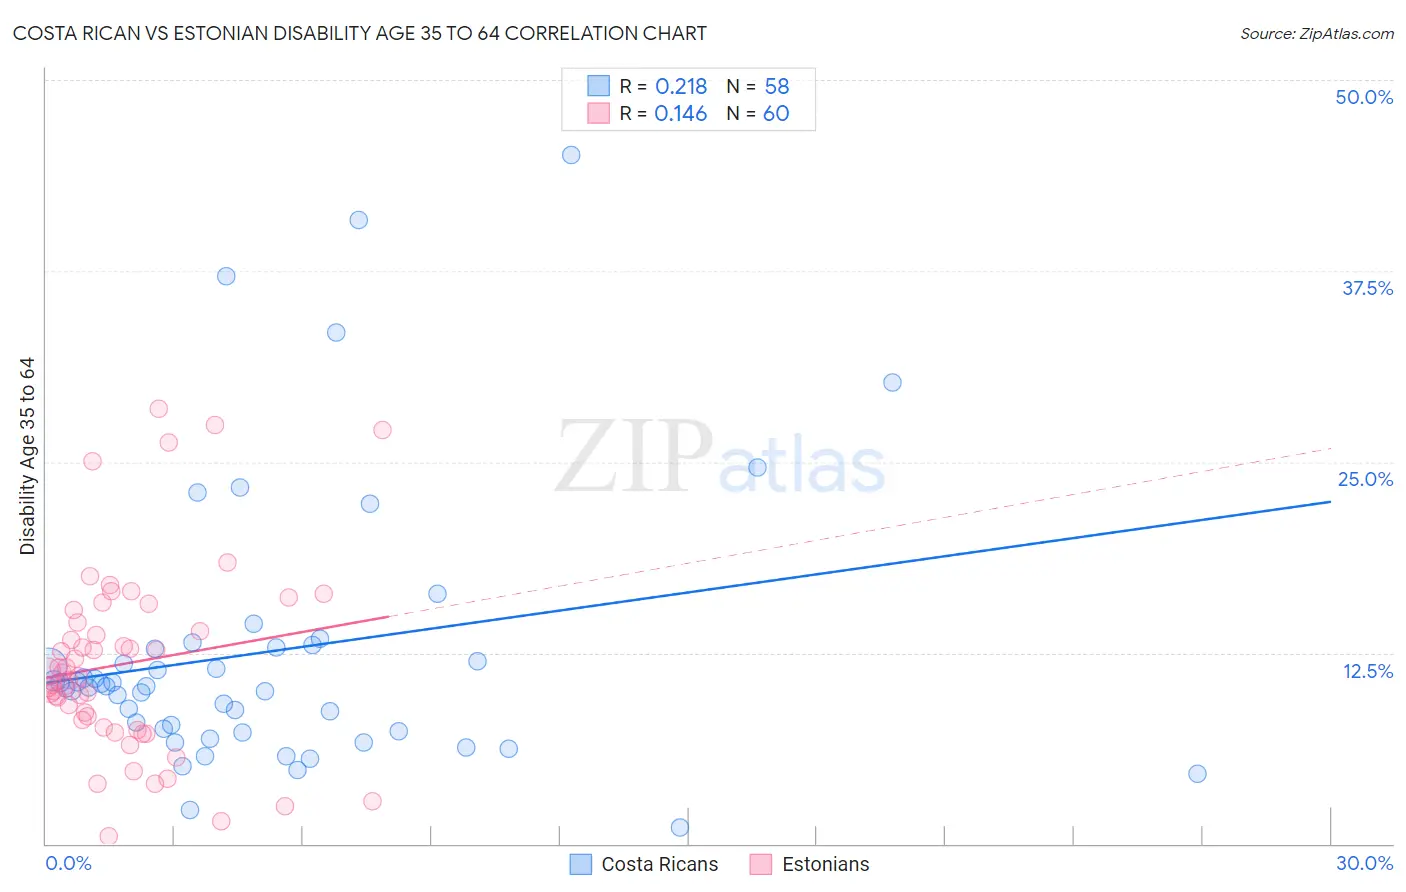
Costa Rican vs Estonian Disability Age 35 to 64 Correlation Chart
The statistical analysis conducted on geographies consisting of 253,472,399 people shows a weak positive correlation between the proportion of Costa Ricans and percentage of population with a disability between the ages 34 and 64 in the United States with a correlation coefficient (R) of 0.218 and weighted average of 10.7%. Similarly, the statistical analysis conducted on geographies consisting of 123,493,933 people shows a poor positive correlation between the proportion of Estonians and percentage of population with a disability between the ages 34 and 64 in the United States with a correlation coefficient (R) of 0.146 and weighted average of 10.6%, a difference of 1.0%.
Disability Age 35 to 64 Correlation Summary
| Measurement | Costa Rican | Estonian |
| Minimum | 1.1% | 0.48% |
| Maximum | 45.1% | 28.4% |
| Range | 44.0% | 28.0% |
| Mean | 12.6% | 11.8% |
| Median | 10.3% | 11.1% |
| Interquartile 25% (IQ1) | 7.4% | 7.9% |
| Interquartile 75% (IQ3) | 12.9% | 14.9% |
| Interquartile Range (IQR) | 5.5% | 7.0% |
| Standard Deviation (Sample) | 9.1% | 6.2% |
| Standard Deviation (Population) | 9.0% | 6.1% |
Demographics Similar to Costa Ricans and Estonians by Disability Age 35 to 64
In terms of disability age 35 to 64, the demographic groups most similar to Costa Ricans are Immigrants from Southern Europe (10.7%, a difference of 0.010%), Immigrants from Scotland (10.7%, a difference of 0.050%), Immigrants from Costa Rica (10.7%, a difference of 0.060%), Salvadoran (10.7%, a difference of 0.13%), and Australian (10.8%, a difference of 0.18%). Similarly, the demographic groups most similar to Estonians are Albanian (10.6%, a difference of 0.10%), Maltese (10.6%, a difference of 0.12%), Immigrants from Afghanistan (10.6%, a difference of 0.16%), Immigrants from Zimbabwe (10.6%, a difference of 0.20%), and Immigrants from Norway (10.6%, a difference of 0.21%).
| Demographics | Rating | Rank | Disability Age 35 to 64 |
| Romanians | 95.0 /100 | #121 | Exceptional 10.6% |
| Immigrants | Norway | 95.0 /100 | #122 | Exceptional 10.6% |
| Maltese | 94.8 /100 | #123 | Exceptional 10.6% |
| Estonians | 94.5 /100 | #124 | Exceptional 10.6% |
| Albanians | 94.2 /100 | #125 | Exceptional 10.6% |
| Immigrants | Afghanistan | 94.1 /100 | #126 | Exceptional 10.6% |
| Immigrants | Zimbabwe | 94.0 /100 | #127 | Exceptional 10.6% |
| South Africans | 93.3 /100 | #128 | Exceptional 10.7% |
| Ecuadorians | 93.1 /100 | #129 | Exceptional 10.7% |
| Immigrants | Syria | 93.0 /100 | #130 | Exceptional 10.7% |
| Immigrants | El Salvador | 92.8 /100 | #131 | Exceptional 10.7% |
| Immigrants | Albania | 92.5 /100 | #132 | Exceptional 10.7% |
| Immigrants | Immigrants | 92.5 /100 | #133 | Exceptional 10.7% |
| Immigrants | Ecuador | 92.5 /100 | #134 | Exceptional 10.7% |
| Greeks | 92.3 /100 | #135 | Exceptional 10.7% |
| Salvadorans | 91.9 /100 | #136 | Exceptional 10.7% |
| Immigrants | Costa Rica | 91.7 /100 | #137 | Exceptional 10.7% |
| Immigrants | Southern Europe | 91.5 /100 | #138 | Exceptional 10.7% |
| Costa Ricans | 91.4 /100 | #139 | Exceptional 10.7% |
| Immigrants | Scotland | 91.3 /100 | #140 | Exceptional 10.7% |
| Australians | 90.7 /100 | #141 | Exceptional 10.8% |