Indian (Asian) vs Estonian No Vehicles in Household
COMPARE
Indian (Asian)
Estonian
No Vehicles in Household
No Vehicles in Household Comparison
Indians (Asian)
Estonians
14.1%
NO VEHICLES IN HOUSEHOLD
0.0/ 100
METRIC RATING
290th/ 347
METRIC RANK
9.8%
NO VEHICLES IN HOUSEHOLD
84.2/ 100
METRIC RATING
138th/ 347
METRIC RANK
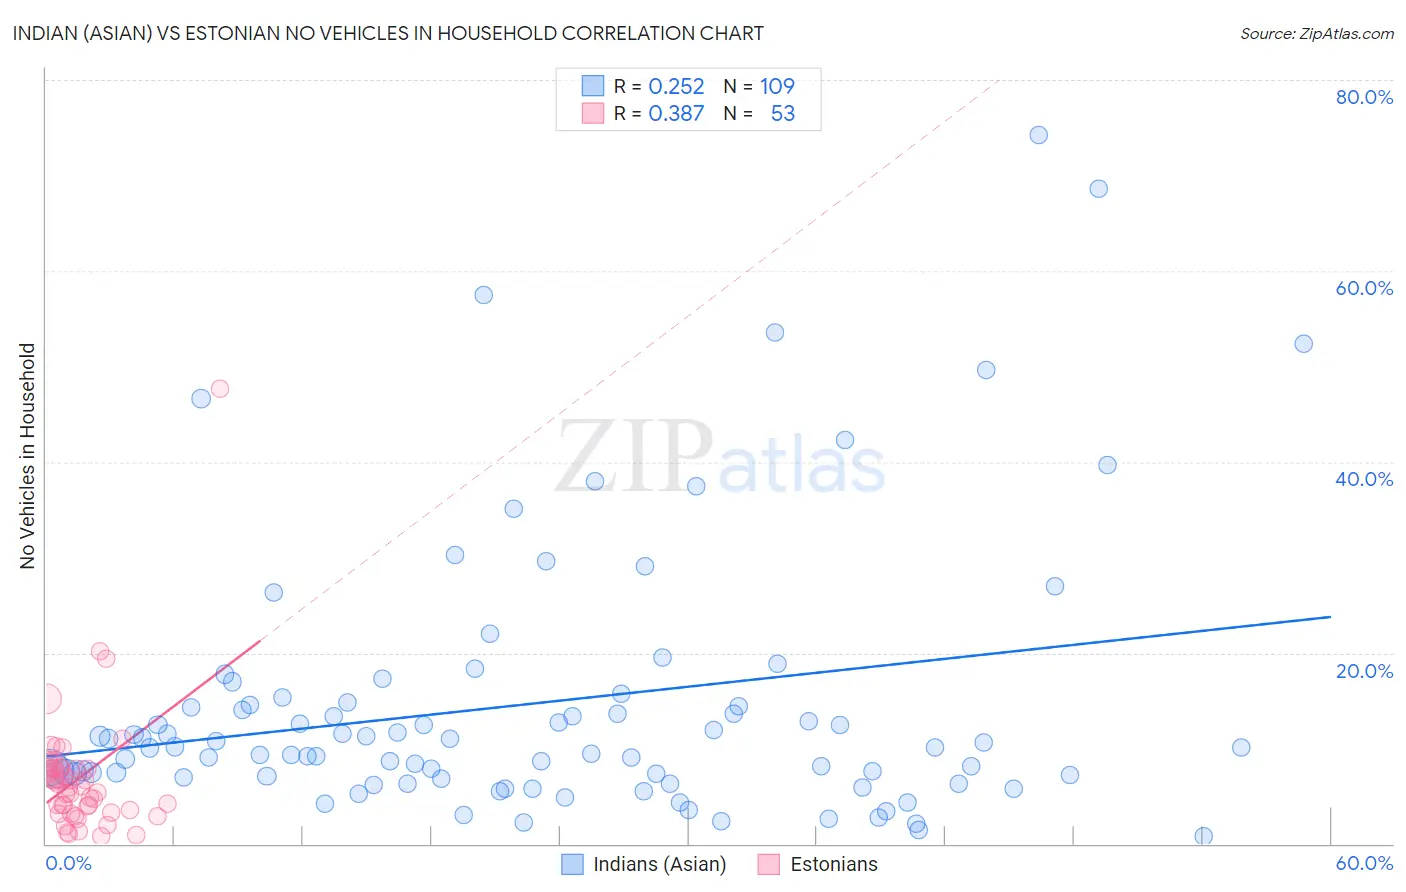
Indian (Asian) vs Estonian No Vehicles in Household Correlation Chart
The statistical analysis conducted on geographies consisting of 492,881,185 people shows a weak positive correlation between the proportion of Indians (Asian) and percentage of households with no vehicle available in the United States with a correlation coefficient (R) of 0.252 and weighted average of 14.1%. Similarly, the statistical analysis conducted on geographies consisting of 123,433,435 people shows a mild positive correlation between the proportion of Estonians and percentage of households with no vehicle available in the United States with a correlation coefficient (R) of 0.387 and weighted average of 9.8%, a difference of 43.3%.
No Vehicles in Household Correlation Summary
| Measurement | Indian (Asian) | Estonian |
| Minimum | 0.81% | 0.84% |
| Maximum | 74.2% | 47.6% |
| Range | 73.4% | 46.8% |
| Mean | 14.7% | 7.0% |
| Median | 10.1% | 6.0% |
| Interquartile 25% (IQ1) | 7.0% | 3.4% |
| Interquartile 75% (IQ3) | 14.7% | 7.9% |
| Interquartile Range (IQR) | 7.7% | 4.5% |
| Standard Deviation (Sample) | 14.2% | 7.0% |
| Standard Deviation (Population) | 14.1% | 6.9% |
Similar Demographics by No Vehicles in Household
Demographics Similar to Indians (Asian) by No Vehicles in Household
In terms of no vehicles in household, the demographic groups most similar to Indians (Asian) are Okinawan (14.1%, a difference of 0.0%), Pima (14.1%, a difference of 0.49%), Immigrants from Jamaica (14.2%, a difference of 1.1%), Immigrants from Australia (13.8%, a difference of 1.7%), and Belizean (14.3%, a difference of 1.9%).
| Demographics | Rating | Rank | No Vehicles in Household |
| Immigrants | Kazakhstan | 0.0 /100 | #283 | Tragic 13.6% |
| Immigrants | Malaysia | 0.0 /100 | #284 | Tragic 13.6% |
| Immigrants | Eastern Europe | 0.0 /100 | #285 | Tragic 13.6% |
| Colville | 0.0 /100 | #286 | Tragic 13.7% |
| Immigrants | Ireland | 0.0 /100 | #287 | Tragic 13.7% |
| Hopi | 0.0 /100 | #288 | Tragic 13.7% |
| Immigrants | Australia | 0.0 /100 | #289 | Tragic 13.8% |
| Indians (Asian) | 0.0 /100 | #290 | Tragic 14.1% |
| Okinawans | 0.0 /100 | #291 | Tragic 14.1% |
| Pima | 0.0 /100 | #292 | Tragic 14.1% |
| Immigrants | Jamaica | 0.0 /100 | #293 | Tragic 14.2% |
| Belizeans | 0.0 /100 | #294 | Tragic 14.3% |
| Paraguayans | 0.0 /100 | #295 | Tragic 14.4% |
| Immigrants | Spain | 0.0 /100 | #296 | Tragic 14.5% |
| Immigrants | Panama | 0.0 /100 | #297 | Tragic 14.6% |
Demographics Similar to Estonians by No Vehicles in Household
In terms of no vehicles in household, the demographic groups most similar to Estonians are Marshallese (9.8%, a difference of 0.050%), Immigrants from Lithuania (9.8%, a difference of 0.060%), Immigrants from Moldova (9.8%, a difference of 0.12%), Immigrants from South Africa (9.8%, a difference of 0.21%), and Latvian (9.8%, a difference of 0.27%).
| Demographics | Rating | Rank | No Vehicles in Household |
| Immigrants | Azores | 88.2 /100 | #131 | Excellent 9.7% |
| Kenyans | 88.0 /100 | #132 | Excellent 9.7% |
| Immigrants | Oceania | 87.1 /100 | #133 | Excellent 9.7% |
| Syrians | 87.1 /100 | #134 | Excellent 9.7% |
| Latvians | 85.1 /100 | #135 | Excellent 9.8% |
| Immigrants | South Africa | 85.0 /100 | #136 | Excellent 9.8% |
| Immigrants | Moldova | 84.6 /100 | #137 | Excellent 9.8% |
| Estonians | 84.2 /100 | #138 | Excellent 9.8% |
| Marshallese | 84.0 /100 | #139 | Excellent 9.8% |
| Immigrants | Lithuania | 84.0 /100 | #140 | Excellent 9.8% |
| Sudanese | 83.1 /100 | #141 | Excellent 9.8% |
| Immigrants | Zimbabwe | 82.6 /100 | #142 | Excellent 9.9% |
| Chileans | 81.2 /100 | #143 | Excellent 9.9% |
| Immigrants | Bahamas | 81.2 /100 | #144 | Excellent 9.9% |
| Bahamians | 81.0 /100 | #145 | Excellent 9.9% |