White/Caucasian vs Estonian No Vehicles in Household
COMPARE
White/Caucasian
Estonian
No Vehicles in Household
No Vehicles in Household Comparison
Whites/Caucasians
Estonians
7.0%
NO VEHICLES IN HOUSEHOLD
100.0/ 100
METRIC RATING
15th/ 347
METRIC RANK
9.8%
NO VEHICLES IN HOUSEHOLD
84.2/ 100
METRIC RATING
138th/ 347
METRIC RANK
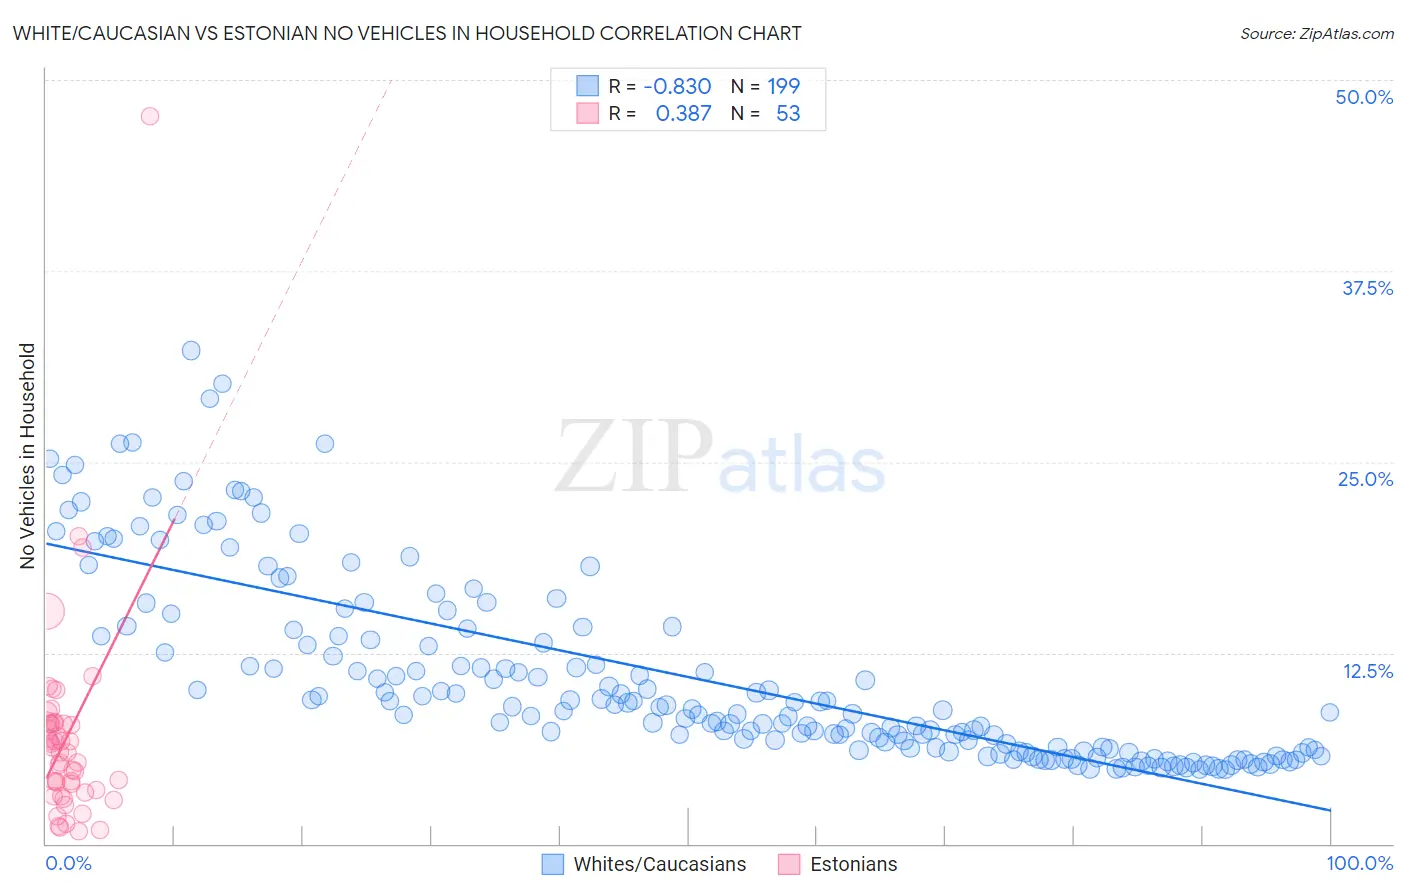
White/Caucasian vs Estonian No Vehicles in Household Correlation Chart
The statistical analysis conducted on geographies consisting of 564,577,305 people shows a very strong negative correlation between the proportion of Whites/Caucasians and percentage of households with no vehicle available in the United States with a correlation coefficient (R) of -0.830 and weighted average of 7.0%. Similarly, the statistical analysis conducted on geographies consisting of 123,433,435 people shows a mild positive correlation between the proportion of Estonians and percentage of households with no vehicle available in the United States with a correlation coefficient (R) of 0.387 and weighted average of 9.8%, a difference of 39.5%.
No Vehicles in Household Correlation Summary
| Measurement | White/Caucasian | Estonian |
| Minimum | 4.8% | 0.84% |
| Maximum | 32.3% | 47.6% |
| Range | 27.4% | 46.8% |
| Mean | 10.9% | 7.0% |
| Median | 8.7% | 6.0% |
| Interquartile 25% (IQ1) | 6.2% | 3.4% |
| Interquartile 75% (IQ3) | 13.6% | 7.9% |
| Interquartile Range (IQR) | 7.4% | 4.5% |
| Standard Deviation (Sample) | 6.1% | 7.0% |
| Standard Deviation (Population) | 6.1% | 6.9% |
Similar Demographics by No Vehicles in Household
Demographics Similar to Whites/Caucasians by No Vehicles in Household
In terms of no vehicles in household, the demographic groups most similar to Whites/Caucasians are Mexican (7.0%, a difference of 0.13%), Scandinavian (7.0%, a difference of 0.30%), Assyrian/Chaldean/Syriac (7.0%, a difference of 0.80%), European (7.1%, a difference of 1.1%), and Welsh (7.2%, a difference of 1.7%).
| Demographics | Rating | Rank | No Vehicles in Household |
| Swedes | 100.0 /100 | #8 | Exceptional 6.8% |
| Scotch-Irish | 100.0 /100 | #9 | Exceptional 6.8% |
| Dutch | 100.0 /100 | #10 | Exceptional 6.8% |
| Czechs | 100.0 /100 | #11 | Exceptional 6.9% |
| Assyrians/Chaldeans/Syriacs | 100.0 /100 | #12 | Exceptional 7.0% |
| Scandinavians | 100.0 /100 | #13 | Exceptional 7.0% |
| Mexicans | 100.0 /100 | #14 | Exceptional 7.0% |
| Whites/Caucasians | 100.0 /100 | #15 | Exceptional 7.0% |
| Europeans | 100.0 /100 | #16 | Exceptional 7.1% |
| Welsh | 100.0 /100 | #17 | Exceptional 7.2% |
| Tongans | 100.0 /100 | #18 | Exceptional 7.2% |
| Arapaho | 100.0 /100 | #19 | Exceptional 7.4% |
| Ottawa | 100.0 /100 | #20 | Exceptional 7.4% |
| Nepalese | 100.0 /100 | #21 | Exceptional 7.4% |
| Irish | 100.0 /100 | #22 | Exceptional 7.4% |
Demographics Similar to Estonians by No Vehicles in Household
In terms of no vehicles in household, the demographic groups most similar to Estonians are Marshallese (9.8%, a difference of 0.050%), Immigrants from Lithuania (9.8%, a difference of 0.060%), Immigrants from Moldova (9.8%, a difference of 0.12%), Immigrants from South Africa (9.8%, a difference of 0.21%), and Latvian (9.8%, a difference of 0.27%).
| Demographics | Rating | Rank | No Vehicles in Household |
| Immigrants | Azores | 88.2 /100 | #131 | Excellent 9.7% |
| Kenyans | 88.0 /100 | #132 | Excellent 9.7% |
| Immigrants | Oceania | 87.1 /100 | #133 | Excellent 9.7% |
| Syrians | 87.1 /100 | #134 | Excellent 9.7% |
| Latvians | 85.1 /100 | #135 | Excellent 9.8% |
| Immigrants | South Africa | 85.0 /100 | #136 | Excellent 9.8% |
| Immigrants | Moldova | 84.6 /100 | #137 | Excellent 9.8% |
| Estonians | 84.2 /100 | #138 | Excellent 9.8% |
| Marshallese | 84.0 /100 | #139 | Excellent 9.8% |
| Immigrants | Lithuania | 84.0 /100 | #140 | Excellent 9.8% |
| Sudanese | 83.1 /100 | #141 | Excellent 9.8% |
| Immigrants | Zimbabwe | 82.6 /100 | #142 | Excellent 9.9% |
| Chileans | 81.2 /100 | #143 | Excellent 9.9% |
| Immigrants | Bahamas | 81.2 /100 | #144 | Excellent 9.9% |
| Bahamians | 81.0 /100 | #145 | Excellent 9.9% |