Costa Rican vs African 4 or more Vehicles in Household
COMPARE
Costa Rican
African
4 or more Vehicles in Household
4 or more Vehicles in Household Comparison
Costa Ricans
Africans
6.8%
4 OR MORE VEHICLES IN HOUSEHOLD
95.5/ 100
METRIC RATING
119th/ 347
METRIC RANK
5.8%
4 OR MORE VEHICLES IN HOUSEHOLD
4.6/ 100
METRIC RATING
234th/ 347
METRIC RANK
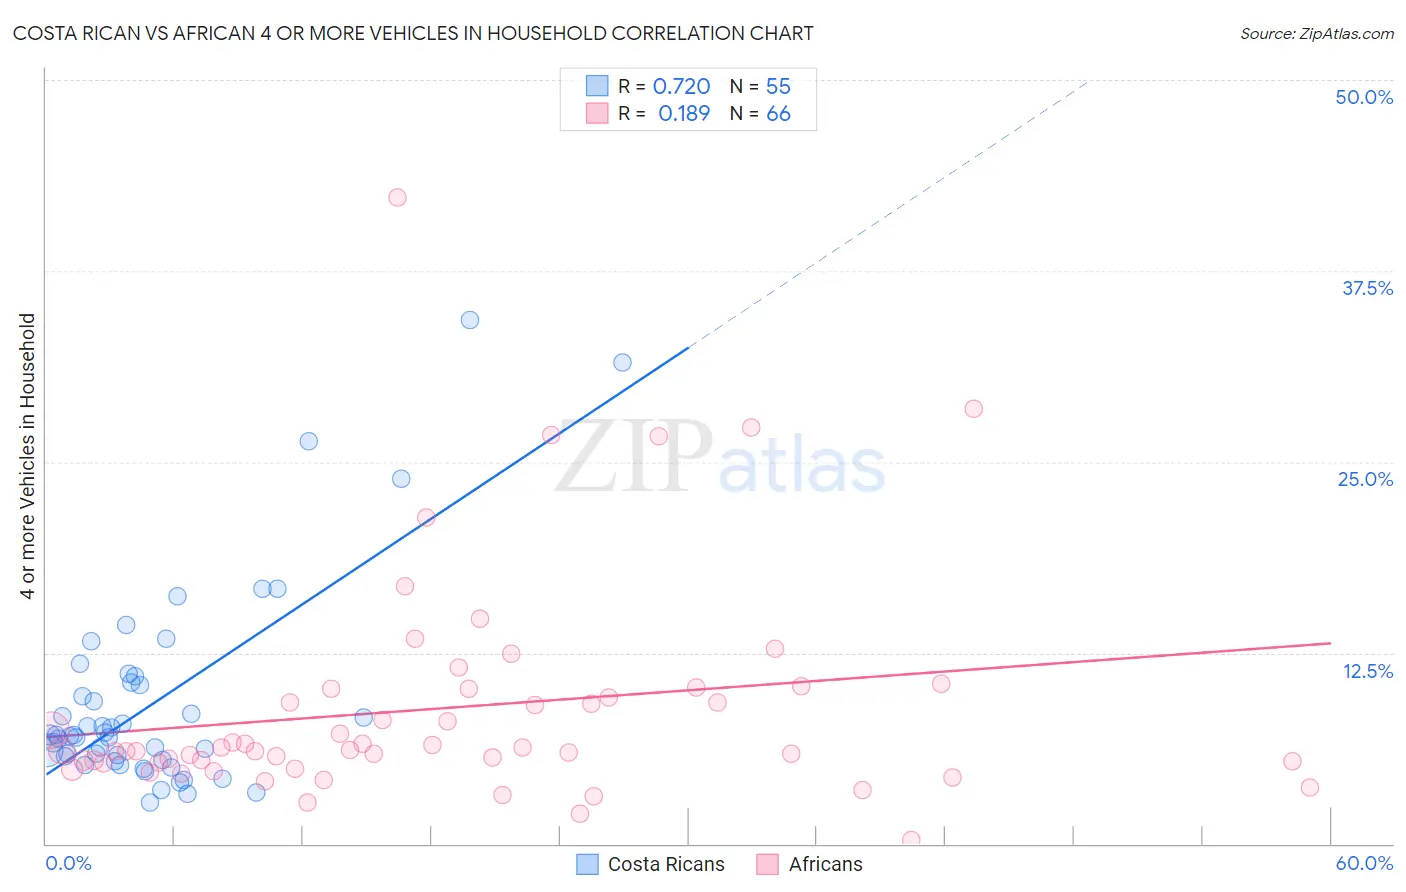
Costa Rican vs African 4 or more Vehicles in Household Correlation Chart
The statistical analysis conducted on geographies consisting of 252,442,983 people shows a strong positive correlation between the proportion of Costa Ricans and percentage of households with 4 or more vehicles available in the United States with a correlation coefficient (R) of 0.720 and weighted average of 6.8%. Similarly, the statistical analysis conducted on geographies consisting of 467,634,971 people shows a poor positive correlation between the proportion of Africans and percentage of households with 4 or more vehicles available in the United States with a correlation coefficient (R) of 0.189 and weighted average of 5.8%, a difference of 16.7%.
4 or more Vehicles in Household Correlation Summary
| Measurement | Costa Rican | African |
| Minimum | 2.7% | 0.25% |
| Maximum | 34.3% | 42.3% |
| Range | 31.6% | 42.1% |
| Mean | 9.3% | 8.9% |
| Median | 7.1% | 6.1% |
| Interquartile 25% (IQ1) | 5.5% | 5.4% |
| Interquartile 75% (IQ3) | 10.6% | 10.2% |
| Interquartile Range (IQR) | 5.1% | 4.8% |
| Standard Deviation (Sample) | 6.6% | 7.3% |
| Standard Deviation (Population) | 6.5% | 7.2% |
Similar Demographics by 4 or more Vehicles in Household
Demographics Similar to Costa Ricans by 4 or more Vehicles in Household
In terms of 4 or more vehicles in household, the demographic groups most similar to Costa Ricans are Burmese (6.8%, a difference of 0.11%), French American Indian (6.8%, a difference of 0.11%), Immigrants from Guatemala (6.8%, a difference of 0.13%), Comanche (6.8%, a difference of 0.36%), and Tlingit-Haida (6.8%, a difference of 0.39%).
| Demographics | Rating | Rank | 4 or more Vehicles in Household |
| Hopi | 97.0 /100 | #112 | Exceptional 6.9% |
| Canadians | 96.4 /100 | #113 | Exceptional 6.9% |
| Bolivians | 96.3 /100 | #114 | Exceptional 6.8% |
| Tlingit-Haida | 96.2 /100 | #115 | Exceptional 6.8% |
| Immigrants | Guatemala | 95.8 /100 | #116 | Exceptional 6.8% |
| Burmese | 95.7 /100 | #117 | Exceptional 6.8% |
| French American Indians | 95.7 /100 | #118 | Exceptional 6.8% |
| Costa Ricans | 95.5 /100 | #119 | Exceptional 6.8% |
| Comanche | 94.8 /100 | #120 | Exceptional 6.8% |
| Immigrants | Germany | 94.7 /100 | #121 | Exceptional 6.8% |
| Immigrants | Nicaragua | 94.7 /100 | #122 | Exceptional 6.8% |
| Immigrants | Immigrants | 94.6 /100 | #123 | Exceptional 6.8% |
| Immigrants | Asia | 94.4 /100 | #124 | Exceptional 6.8% |
| Austrians | 94.1 /100 | #125 | Exceptional 6.8% |
| Belgians | 94.1 /100 | #126 | Exceptional 6.8% |
Demographics Similar to Africans by 4 or more Vehicles in Household
In terms of 4 or more vehicles in household, the demographic groups most similar to Africans are Immigrants from Hungary (5.8%, a difference of 0.020%), Immigrants from Eritrea (5.8%, a difference of 0.030%), Turkish (5.8%, a difference of 0.31%), Immigrants from Belgium (5.8%, a difference of 0.44%), and Immigrants from Australia (5.8%, a difference of 0.53%).
| Demographics | Rating | Rank | 4 or more Vehicles in Household |
| Immigrants | Western Asia | 7.8 /100 | #227 | Tragic 5.9% |
| Immigrants | Uganda | 7.5 /100 | #228 | Tragic 5.9% |
| Eastern Europeans | 6.8 /100 | #229 | Tragic 5.9% |
| Immigrants | Malaysia | 6.7 /100 | #230 | Tragic 5.9% |
| Immigrants | Switzerland | 6.4 /100 | #231 | Tragic 5.9% |
| Immigrants | Argentina | 6.0 /100 | #232 | Tragic 5.9% |
| Sierra Leoneans | 6.0 /100 | #233 | Tragic 5.9% |
| Africans | 4.6 /100 | #234 | Tragic 5.8% |
| Immigrants | Hungary | 4.6 /100 | #235 | Tragic 5.8% |
| Immigrants | Eritrea | 4.5 /100 | #236 | Tragic 5.8% |
| Turks | 4.1 /100 | #237 | Tragic 5.8% |
| Immigrants | Belgium | 4.0 /100 | #238 | Tragic 5.8% |
| Immigrants | Australia | 3.8 /100 | #239 | Tragic 5.8% |
| Immigrants | Poland | 3.8 /100 | #240 | Tragic 5.8% |
| Mongolians | 3.7 /100 | #241 | Tragic 5.8% |