Inupiat vs African 4 or more Vehicles in Household
COMPARE
Inupiat
African
4 or more Vehicles in Household
4 or more Vehicles in Household Comparison
Inupiat
Africans
6.2%
4 OR MORE VEHICLES IN HOUSEHOLD
30.7/ 100
METRIC RATING
191st/ 347
METRIC RANK
5.8%
4 OR MORE VEHICLES IN HOUSEHOLD
4.6/ 100
METRIC RATING
234th/ 347
METRIC RANK
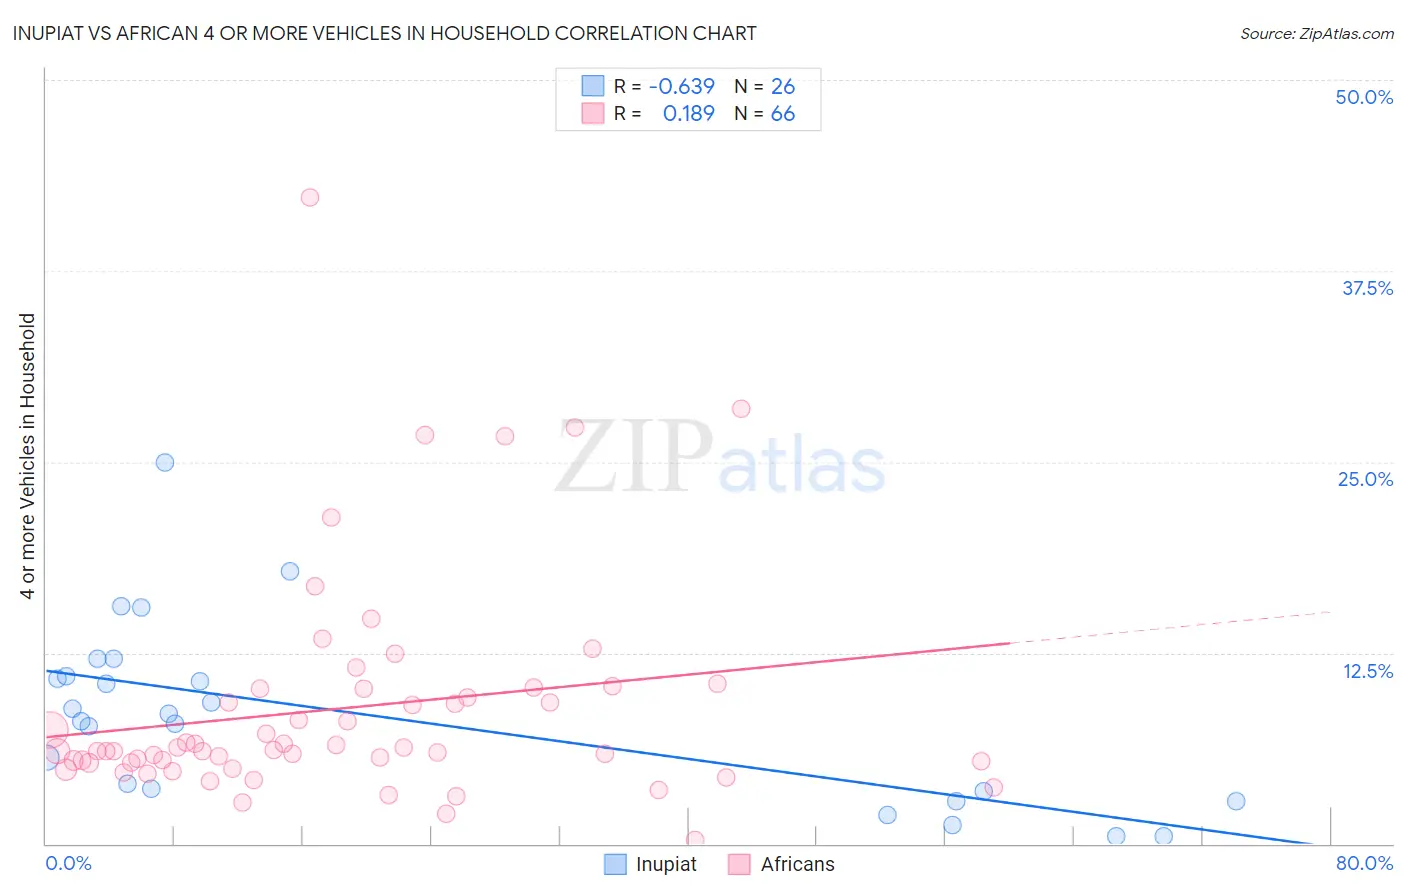
Inupiat vs African 4 or more Vehicles in Household Correlation Chart
The statistical analysis conducted on geographies consisting of 96,224,562 people shows a significant negative correlation between the proportion of Inupiat and percentage of households with 4 or more vehicles available in the United States with a correlation coefficient (R) of -0.639 and weighted average of 6.2%. Similarly, the statistical analysis conducted on geographies consisting of 467,634,971 people shows a poor positive correlation between the proportion of Africans and percentage of households with 4 or more vehicles available in the United States with a correlation coefficient (R) of 0.189 and weighted average of 5.8%, a difference of 6.1%.
4 or more Vehicles in Household Correlation Summary
| Measurement | Inupiat | African |
| Minimum | 0.47% | 0.25% |
| Maximum | 25.0% | 42.3% |
| Range | 24.5% | 42.1% |
| Mean | 8.4% | 8.9% |
| Median | 8.3% | 6.1% |
| Interquartile 25% (IQ1) | 3.4% | 5.4% |
| Interquartile 75% (IQ3) | 11.0% | 10.2% |
| Interquartile Range (IQR) | 7.5% | 4.8% |
| Standard Deviation (Sample) | 5.9% | 7.3% |
| Standard Deviation (Population) | 5.8% | 7.2% |
Similar Demographics by 4 or more Vehicles in Household
Demographics Similar to Inupiat by 4 or more Vehicles in Household
In terms of 4 or more vehicles in household, the demographic groups most similar to Inupiat are Romanian (6.2%, a difference of 0.010%), South African (6.2%, a difference of 0.18%), Immigrants from Eastern Asia (6.2%, a difference of 0.30%), Immigrants from Kuwait (6.2%, a difference of 0.35%), and Kiowa (6.2%, a difference of 0.47%).
| Demographics | Rating | Rank | 4 or more Vehicles in Household |
| Iraqis | 37.3 /100 | #184 | Fair 6.2% |
| Thais | 36.9 /100 | #185 | Fair 6.2% |
| Immigrants | Northern Europe | 36.8 /100 | #186 | Fair 6.2% |
| Immigrants | South Africa | 35.4 /100 | #187 | Fair 6.2% |
| Kiowa | 34.7 /100 | #188 | Fair 6.2% |
| Immigrants | Eastern Asia | 33.3 /100 | #189 | Fair 6.2% |
| South Africans | 32.2 /100 | #190 | Fair 6.2% |
| Inupiat | 30.7 /100 | #191 | Fair 6.2% |
| Romanians | 30.7 /100 | #192 | Fair 6.2% |
| Immigrants | Kuwait | 28.0 /100 | #193 | Fair 6.2% |
| Immigrants | Sweden | 27.0 /100 | #194 | Fair 6.2% |
| Argentineans | 27.0 /100 | #195 | Fair 6.2% |
| Tsimshian | 26.4 /100 | #196 | Fair 6.2% |
| Immigrants | Sri Lanka | 23.7 /100 | #197 | Fair 6.1% |
| Immigrants | Portugal | 22.3 /100 | #198 | Fair 6.1% |
Demographics Similar to Africans by 4 or more Vehicles in Household
In terms of 4 or more vehicles in household, the demographic groups most similar to Africans are Immigrants from Hungary (5.8%, a difference of 0.020%), Immigrants from Eritrea (5.8%, a difference of 0.030%), Turkish (5.8%, a difference of 0.31%), Immigrants from Belgium (5.8%, a difference of 0.44%), and Immigrants from Australia (5.8%, a difference of 0.53%).
| Demographics | Rating | Rank | 4 or more Vehicles in Household |
| Immigrants | Western Asia | 7.8 /100 | #227 | Tragic 5.9% |
| Immigrants | Uganda | 7.5 /100 | #228 | Tragic 5.9% |
| Eastern Europeans | 6.8 /100 | #229 | Tragic 5.9% |
| Immigrants | Malaysia | 6.7 /100 | #230 | Tragic 5.9% |
| Immigrants | Switzerland | 6.4 /100 | #231 | Tragic 5.9% |
| Immigrants | Argentina | 6.0 /100 | #232 | Tragic 5.9% |
| Sierra Leoneans | 6.0 /100 | #233 | Tragic 5.9% |
| Africans | 4.6 /100 | #234 | Tragic 5.8% |
| Immigrants | Hungary | 4.6 /100 | #235 | Tragic 5.8% |
| Immigrants | Eritrea | 4.5 /100 | #236 | Tragic 5.8% |
| Turks | 4.1 /100 | #237 | Tragic 5.8% |
| Immigrants | Belgium | 4.0 /100 | #238 | Tragic 5.8% |
| Immigrants | Australia | 3.8 /100 | #239 | Tragic 5.8% |
| Immigrants | Poland | 3.8 /100 | #240 | Tragic 5.8% |
| Mongolians | 3.7 /100 | #241 | Tragic 5.8% |