Immigrants from Canada vs African 4 or more Vehicles in Household
COMPARE
Immigrants from Canada
African
4 or more Vehicles in Household
4 or more Vehicles in Household Comparison
Immigrants from Canada
Africans
6.5%
4 OR MORE VEHICLES IN HOUSEHOLD
78.6/ 100
METRIC RATING
143rd/ 347
METRIC RANK
5.8%
4 OR MORE VEHICLES IN HOUSEHOLD
4.6/ 100
METRIC RATING
234th/ 347
METRIC RANK
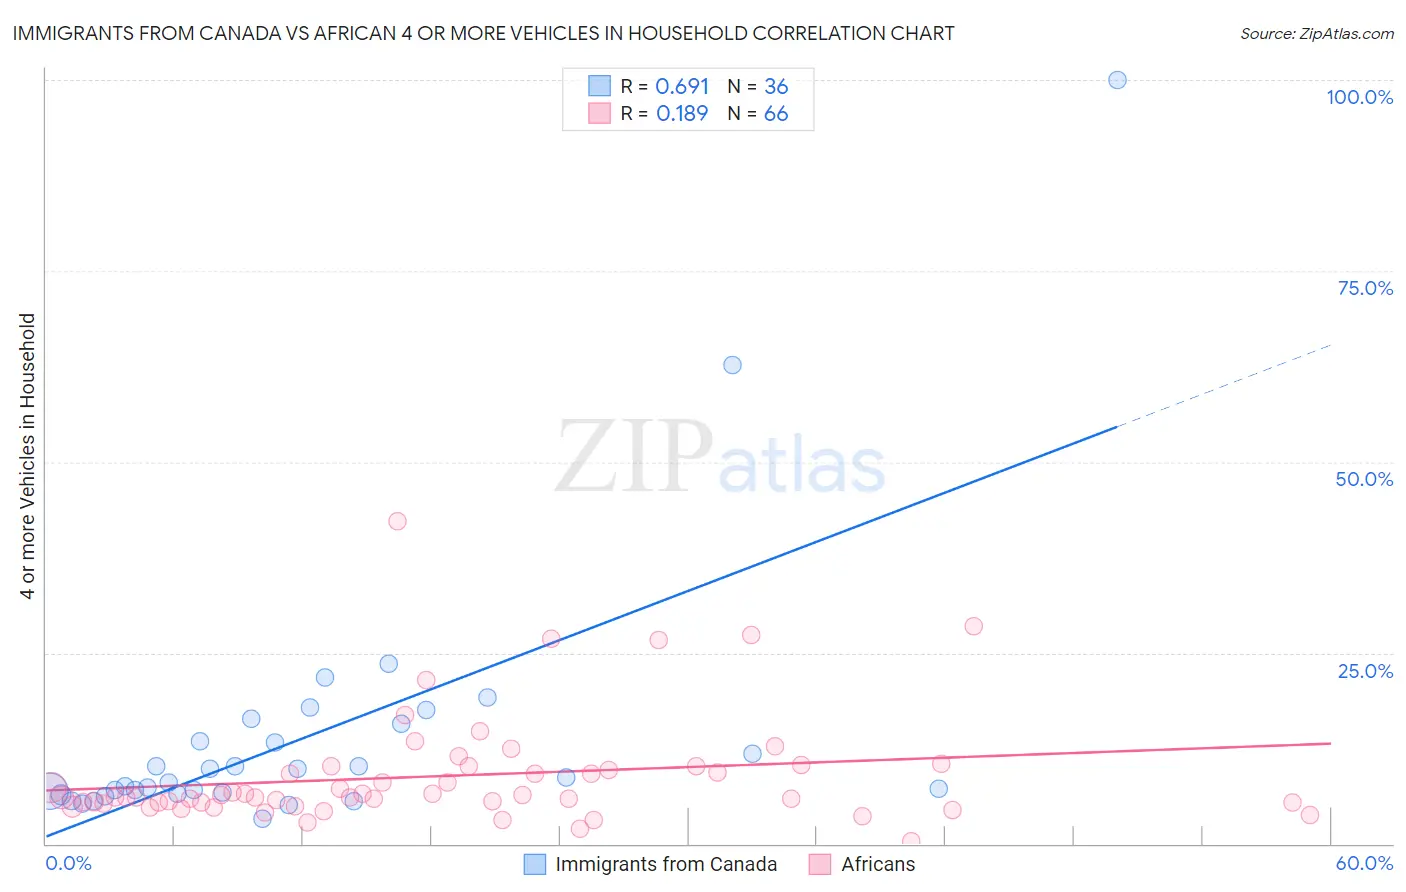
Immigrants from Canada vs African 4 or more Vehicles in Household Correlation Chart
The statistical analysis conducted on geographies consisting of 457,196,725 people shows a significant positive correlation between the proportion of Immigrants from Canada and percentage of households with 4 or more vehicles available in the United States with a correlation coefficient (R) of 0.691 and weighted average of 6.5%. Similarly, the statistical analysis conducted on geographies consisting of 467,634,971 people shows a poor positive correlation between the proportion of Africans and percentage of households with 4 or more vehicles available in the United States with a correlation coefficient (R) of 0.189 and weighted average of 5.8%, a difference of 11.9%.
4 or more Vehicles in Household Correlation Summary
| Measurement | Immigrants from Canada | African |
| Minimum | 3.3% | 0.25% |
| Maximum | 100.0% | 42.3% |
| Range | 96.7% | 42.1% |
| Mean | 14.1% | 8.9% |
| Median | 8.4% | 6.1% |
| Interquartile 25% (IQ1) | 6.7% | 5.4% |
| Interquartile 75% (IQ3) | 14.6% | 10.2% |
| Interquartile Range (IQR) | 7.9% | 4.8% |
| Standard Deviation (Sample) | 17.9% | 7.3% |
| Standard Deviation (Population) | 17.6% | 7.2% |
Similar Demographics by 4 or more Vehicles in Household
Demographics Similar to Immigrants from Canada by 4 or more Vehicles in Household
In terms of 4 or more vehicles in household, the demographic groups most similar to Immigrants from Canada are Immigrants from North America (6.5%, a difference of 0.020%), Croatian (6.5%, a difference of 0.11%), Immigrants from Iraq (6.5%, a difference of 0.13%), Australian (6.6%, a difference of 0.33%), and Slavic (6.6%, a difference of 0.46%).
| Demographics | Rating | Rank | 4 or more Vehicles in Household |
| Luxembourgers | 86.4 /100 | #136 | Excellent 6.6% |
| French Canadians | 85.4 /100 | #137 | Excellent 6.6% |
| Italians | 84.5 /100 | #138 | Excellent 6.6% |
| Jordanians | 82.1 /100 | #139 | Excellent 6.6% |
| Slavs | 81.6 /100 | #140 | Excellent 6.6% |
| Australians | 80.8 /100 | #141 | Excellent 6.6% |
| Immigrants | Iraq | 79.4 /100 | #142 | Good 6.5% |
| Immigrants | Canada | 78.6 /100 | #143 | Good 6.5% |
| Immigrants | North America | 78.5 /100 | #144 | Good 6.5% |
| Croatians | 77.8 /100 | #145 | Good 6.5% |
| Immigrants | Costa Rica | 74.4 /100 | #146 | Good 6.5% |
| Immigrants | Iran | 73.9 /100 | #147 | Good 6.5% |
| Immigrants | Jordan | 73.7 /100 | #148 | Good 6.5% |
| Greeks | 73.6 /100 | #149 | Good 6.5% |
| New Zealanders | 73.3 /100 | #150 | Good 6.5% |
Demographics Similar to Africans by 4 or more Vehicles in Household
In terms of 4 or more vehicles in household, the demographic groups most similar to Africans are Immigrants from Hungary (5.8%, a difference of 0.020%), Immigrants from Eritrea (5.8%, a difference of 0.030%), Turkish (5.8%, a difference of 0.31%), Immigrants from Belgium (5.8%, a difference of 0.44%), and Immigrants from Australia (5.8%, a difference of 0.53%).
| Demographics | Rating | Rank | 4 or more Vehicles in Household |
| Immigrants | Western Asia | 7.8 /100 | #227 | Tragic 5.9% |
| Immigrants | Uganda | 7.5 /100 | #228 | Tragic 5.9% |
| Eastern Europeans | 6.8 /100 | #229 | Tragic 5.9% |
| Immigrants | Malaysia | 6.7 /100 | #230 | Tragic 5.9% |
| Immigrants | Switzerland | 6.4 /100 | #231 | Tragic 5.9% |
| Immigrants | Argentina | 6.0 /100 | #232 | Tragic 5.9% |
| Sierra Leoneans | 6.0 /100 | #233 | Tragic 5.9% |
| Africans | 4.6 /100 | #234 | Tragic 5.8% |
| Immigrants | Hungary | 4.6 /100 | #235 | Tragic 5.8% |
| Immigrants | Eritrea | 4.5 /100 | #236 | Tragic 5.8% |
| Turks | 4.1 /100 | #237 | Tragic 5.8% |
| Immigrants | Belgium | 4.0 /100 | #238 | Tragic 5.8% |
| Immigrants | Australia | 3.8 /100 | #239 | Tragic 5.8% |
| Immigrants | Poland | 3.8 /100 | #240 | Tragic 5.8% |
| Mongolians | 3.7 /100 | #241 | Tragic 5.8% |