Costa Rican vs African Male Unemployment
COMPARE
Costa Rican
African
Male Unemployment
Male Unemployment Comparison
Costa Ricans
Africans
5.4%
MALE UNEMPLOYMENT
31.3/ 100
METRIC RATING
187th/ 347
METRIC RANK
6.3%
MALE UNEMPLOYMENT
0.0/ 100
METRIC RATING
286th/ 347
METRIC RANK
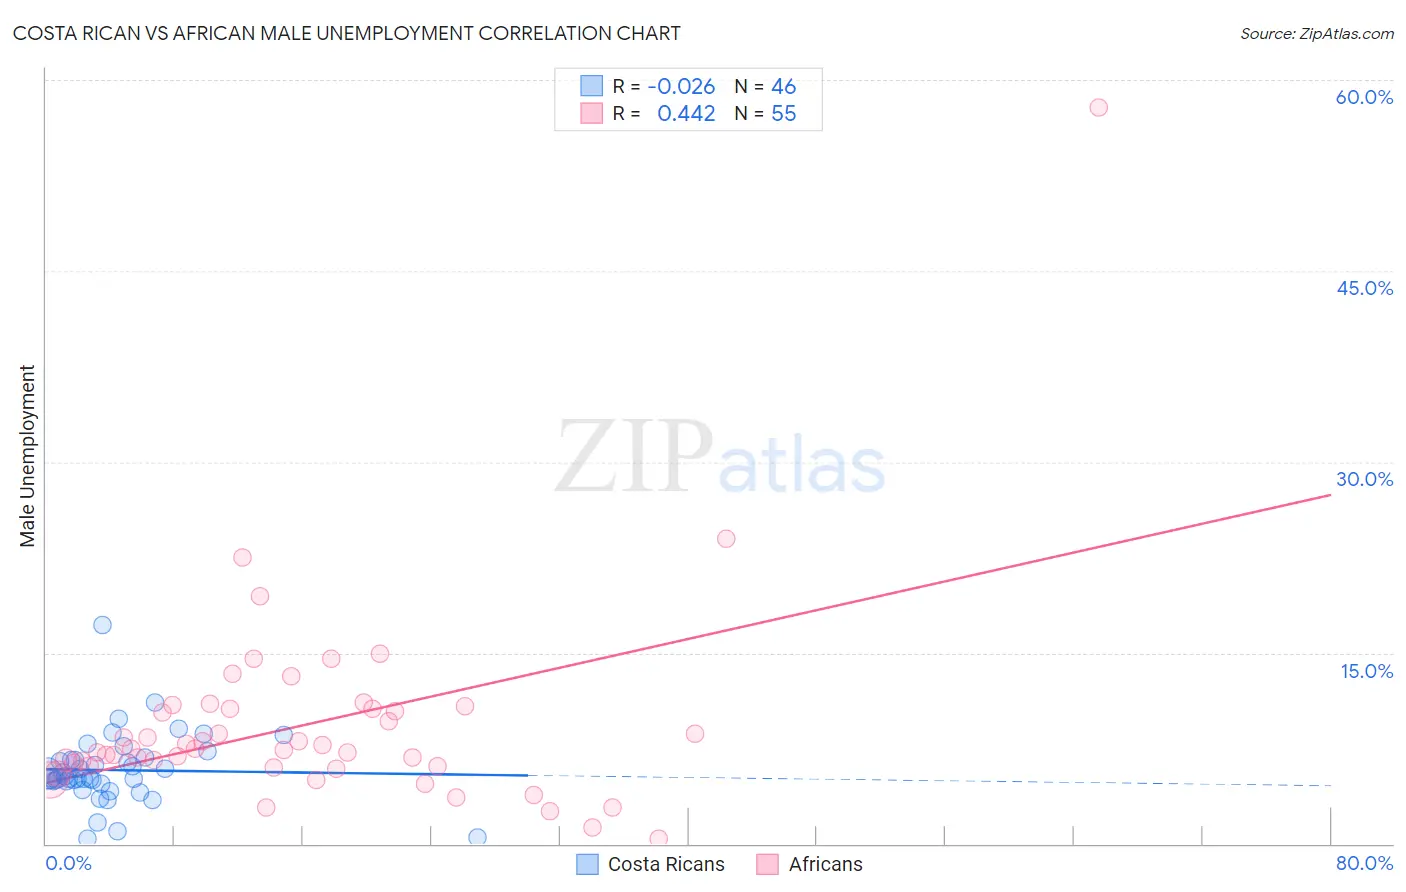
Costa Rican vs African Male Unemployment Correlation Chart
The statistical analysis conducted on geographies consisting of 253,200,475 people shows no correlation between the proportion of Costa Ricans and unemployment rate among males in the United States with a correlation coefficient (R) of -0.026 and weighted average of 5.4%. Similarly, the statistical analysis conducted on geographies consisting of 467,193,011 people shows a moderate positive correlation between the proportion of Africans and unemployment rate among males in the United States with a correlation coefficient (R) of 0.442 and weighted average of 6.3%, a difference of 16.8%.
Male Unemployment Correlation Summary
| Measurement | Costa Rican | African |
| Minimum | 0.35% | 0.40% |
| Maximum | 17.2% | 57.8% |
| Range | 16.8% | 57.4% |
| Mean | 5.8% | 9.3% |
| Median | 5.2% | 7.5% |
| Interquartile 25% (IQ1) | 4.9% | 6.1% |
| Interquartile 75% (IQ3) | 6.6% | 10.6% |
| Interquartile Range (IQR) | 1.8% | 4.5% |
| Standard Deviation (Sample) | 2.8% | 8.1% |
| Standard Deviation (Population) | 2.8% | 8.0% |
Similar Demographics by Male Unemployment
Demographics Similar to Costa Ricans by Male Unemployment
In terms of male unemployment, the demographic groups most similar to Costa Ricans are Iraqi (5.4%, a difference of 0.010%), Arab (5.4%, a difference of 0.080%), Immigrants from South America (5.4%, a difference of 0.13%), Immigrants from Uganda (5.4%, a difference of 0.18%), and Immigrants from South Eastern Asia (5.4%, a difference of 0.21%).
| Demographics | Rating | Rank | Male Unemployment |
| Malaysians | 39.6 /100 | #180 | Fair 5.3% |
| Immigrants | Afghanistan | 37.9 /100 | #181 | Fair 5.3% |
| Potawatomi | 37.8 /100 | #182 | Fair 5.3% |
| Taiwanese | 37.6 /100 | #183 | Fair 5.3% |
| Spaniards | 35.1 /100 | #184 | Fair 5.3% |
| Koreans | 34.9 /100 | #185 | Fair 5.3% |
| Iraqis | 31.6 /100 | #186 | Fair 5.4% |
| Costa Ricans | 31.3 /100 | #187 | Fair 5.4% |
| Arabs | 30.2 /100 | #188 | Fair 5.4% |
| Immigrants | South America | 29.4 /100 | #189 | Fair 5.4% |
| Immigrants | Uganda | 28.8 /100 | #190 | Fair 5.4% |
| Immigrants | South Eastern Asia | 28.2 /100 | #191 | Fair 5.4% |
| Immigrants | Belarus | 26.0 /100 | #192 | Fair 5.4% |
| Immigrants | Israel | 25.2 /100 | #193 | Fair 5.4% |
| Spanish | 19.7 /100 | #194 | Poor 5.4% |
Demographics Similar to Africans by Male Unemployment
In terms of male unemployment, the demographic groups most similar to Africans are Central American Indian (6.3%, a difference of 0.29%), Immigrants from Senegal (6.3%, a difference of 0.33%), Immigrants from Ecuador (6.2%, a difference of 0.43%), Spanish American Indian (6.2%, a difference of 0.45%), and Immigrants from Caribbean (6.3%, a difference of 0.45%).
| Demographics | Rating | Rank | Male Unemployment |
| Ghanaians | 0.0 /100 | #279 | Tragic 6.1% |
| Immigrants | Ghana | 0.0 /100 | #280 | Tragic 6.2% |
| Sierra Leoneans | 0.0 /100 | #281 | Tragic 6.2% |
| Ecuadorians | 0.0 /100 | #282 | Tragic 6.2% |
| Immigrants | Western Africa | 0.0 /100 | #283 | Tragic 6.2% |
| Spanish American Indians | 0.0 /100 | #284 | Tragic 6.2% |
| Immigrants | Ecuador | 0.0 /100 | #285 | Tragic 6.2% |
| Africans | 0.0 /100 | #286 | Tragic 6.3% |
| Central American Indians | 0.0 /100 | #287 | Tragic 6.3% |
| Immigrants | Senegal | 0.0 /100 | #288 | Tragic 6.3% |
| Immigrants | Caribbean | 0.0 /100 | #289 | Tragic 6.3% |
| U.S. Virgin Islanders | 0.0 /100 | #290 | Tragic 6.4% |
| Immigrants | Azores | 0.0 /100 | #291 | Tragic 6.4% |
| Nepalese | 0.0 /100 | #292 | Tragic 6.4% |
| Haitians | 0.0 /100 | #293 | Tragic 6.4% |