Costa Rican vs Carpatho Rusyn 4 or more Vehicles in Household
COMPARE
Costa Rican
Carpatho Rusyn
4 or more Vehicles in Household
4 or more Vehicles in Household Comparison
Costa Ricans
Carpatho Rusyns
6.8%
4 OR MORE VEHICLES IN HOUSEHOLD
95.5/ 100
METRIC RATING
119th/ 347
METRIC RANK
5.5%
4 OR MORE VEHICLES IN HOUSEHOLD
0.7/ 100
METRIC RATING
269th/ 347
METRIC RANK
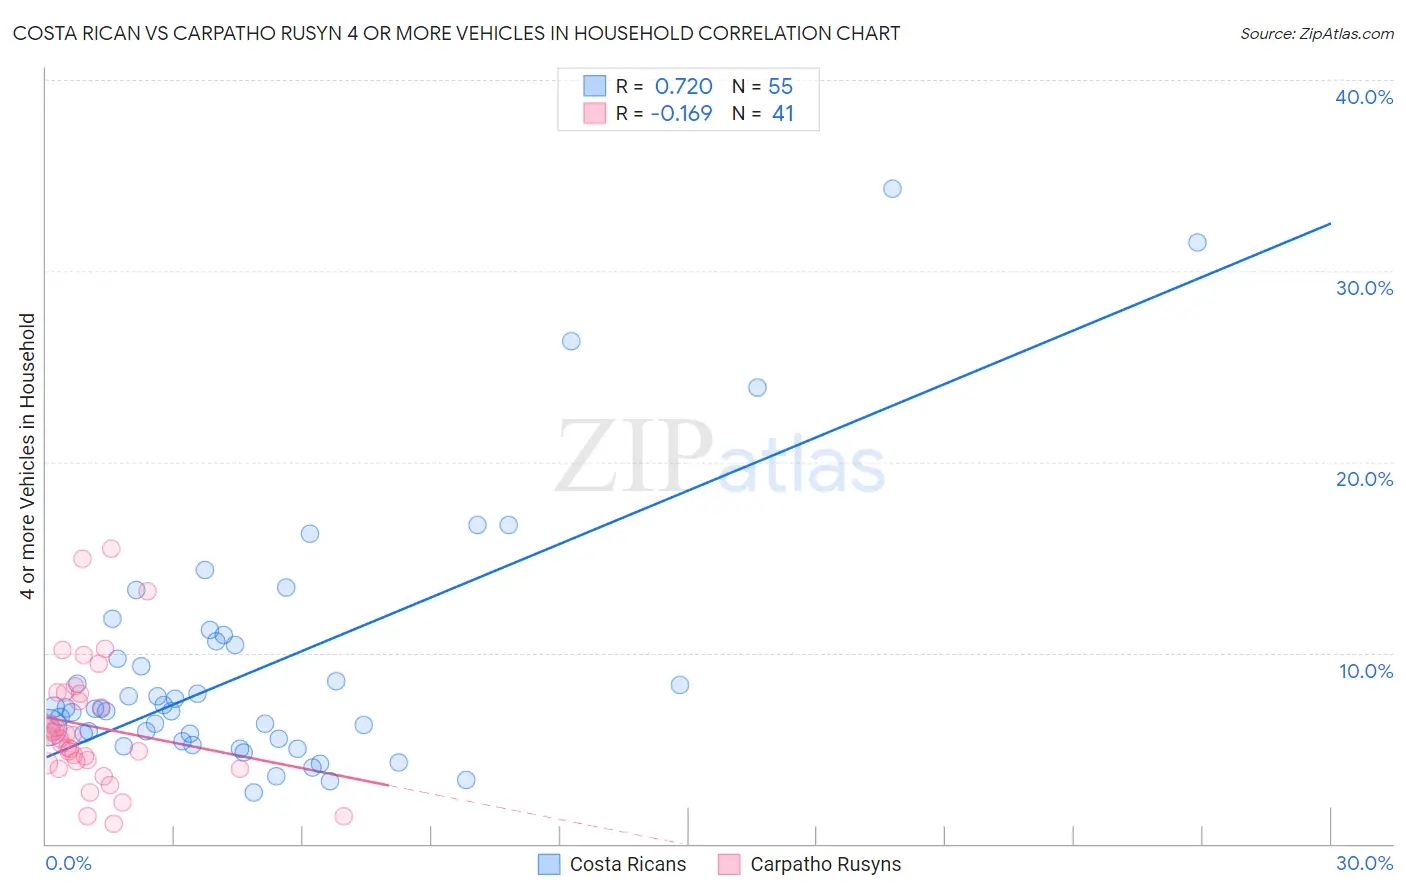
Costa Rican vs Carpatho Rusyn 4 or more Vehicles in Household Correlation Chart
The statistical analysis conducted on geographies consisting of 252,442,983 people shows a strong positive correlation between the proportion of Costa Ricans and percentage of households with 4 or more vehicles available in the United States with a correlation coefficient (R) of 0.720 and weighted average of 6.8%. Similarly, the statistical analysis conducted on geographies consisting of 58,837,800 people shows a poor negative correlation between the proportion of Carpatho Rusyns and percentage of households with 4 or more vehicles available in the United States with a correlation coefficient (R) of -0.169 and weighted average of 5.5%, a difference of 23.2%.
4 or more Vehicles in Household Correlation Summary
| Measurement | Costa Rican | Carpatho Rusyn |
| Minimum | 2.7% | 1.0% |
| Maximum | 34.3% | 15.4% |
| Range | 31.6% | 14.4% |
| Mean | 9.3% | 6.2% |
| Median | 7.1% | 5.6% |
| Interquartile 25% (IQ1) | 5.5% | 4.3% |
| Interquartile 75% (IQ3) | 10.6% | 7.9% |
| Interquartile Range (IQR) | 5.1% | 3.6% |
| Standard Deviation (Sample) | 6.6% | 3.3% |
| Standard Deviation (Population) | 6.5% | 3.3% |
Similar Demographics by 4 or more Vehicles in Household
Demographics Similar to Costa Ricans by 4 or more Vehicles in Household
In terms of 4 or more vehicles in household, the demographic groups most similar to Costa Ricans are Burmese (6.8%, a difference of 0.11%), French American Indian (6.8%, a difference of 0.11%), Immigrants from Guatemala (6.8%, a difference of 0.13%), Comanche (6.8%, a difference of 0.36%), and Tlingit-Haida (6.8%, a difference of 0.39%).
| Demographics | Rating | Rank | 4 or more Vehicles in Household |
| Hopi | 97.0 /100 | #112 | Exceptional 6.9% |
| Canadians | 96.4 /100 | #113 | Exceptional 6.9% |
| Bolivians | 96.3 /100 | #114 | Exceptional 6.8% |
| Tlingit-Haida | 96.2 /100 | #115 | Exceptional 6.8% |
| Immigrants | Guatemala | 95.8 /100 | #116 | Exceptional 6.8% |
| Burmese | 95.7 /100 | #117 | Exceptional 6.8% |
| French American Indians | 95.7 /100 | #118 | Exceptional 6.8% |
| Costa Ricans | 95.5 /100 | #119 | Exceptional 6.8% |
| Comanche | 94.8 /100 | #120 | Exceptional 6.8% |
| Immigrants | Germany | 94.7 /100 | #121 | Exceptional 6.8% |
| Immigrants | Nicaragua | 94.7 /100 | #122 | Exceptional 6.8% |
| Immigrants | Immigrants | 94.6 /100 | #123 | Exceptional 6.8% |
| Immigrants | Asia | 94.4 /100 | #124 | Exceptional 6.8% |
| Austrians | 94.1 /100 | #125 | Exceptional 6.8% |
| Belgians | 94.1 /100 | #126 | Exceptional 6.8% |
Demographics Similar to Carpatho Rusyns by 4 or more Vehicles in Household
In terms of 4 or more vehicles in household, the demographic groups most similar to Carpatho Rusyns are Colombian (5.5%, a difference of 0.16%), Okinawan (5.5%, a difference of 0.20%), Immigrants from Sudan (5.5%, a difference of 0.30%), Immigrants from Kazakhstan (5.5%, a difference of 0.50%), and Macedonian (5.5%, a difference of 0.53%).
| Demographics | Rating | Rank | 4 or more Vehicles in Household |
| Bermudans | 1.2 /100 | #262 | Tragic 5.6% |
| Immigrants | Saudi Arabia | 1.1 /100 | #263 | Tragic 5.6% |
| Immigrants | Africa | 1.0 /100 | #264 | Tragic 5.6% |
| South Americans | 0.9 /100 | #265 | Tragic 5.6% |
| Immigrants | Nepal | 0.9 /100 | #266 | Tragic 5.6% |
| Immigrants | Ukraine | 0.9 /100 | #267 | Tragic 5.6% |
| Colombians | 0.7 /100 | #268 | Tragic 5.5% |
| Carpatho Rusyns | 0.7 /100 | #269 | Tragic 5.5% |
| Okinawans | 0.6 /100 | #270 | Tragic 5.5% |
| Immigrants | Sudan | 0.6 /100 | #271 | Tragic 5.5% |
| Immigrants | Kazakhstan | 0.6 /100 | #272 | Tragic 5.5% |
| Macedonians | 0.6 /100 | #273 | Tragic 5.5% |
| Blacks/African Americans | 0.6 /100 | #274 | Tragic 5.5% |
| Cambodians | 0.5 /100 | #275 | Tragic 5.5% |
| Immigrants | Latvia | 0.5 /100 | #276 | Tragic 5.5% |