Iroquois vs African 4 or more Vehicles in Household
COMPARE
Iroquois
African
4 or more Vehicles in Household
4 or more Vehicles in Household Comparison
Iroquois
Africans
6.5%
4 OR MORE VEHICLES IN HOUSEHOLD
70.4/ 100
METRIC RATING
155th/ 347
METRIC RANK
5.8%
4 OR MORE VEHICLES IN HOUSEHOLD
4.6/ 100
METRIC RATING
234th/ 347
METRIC RANK
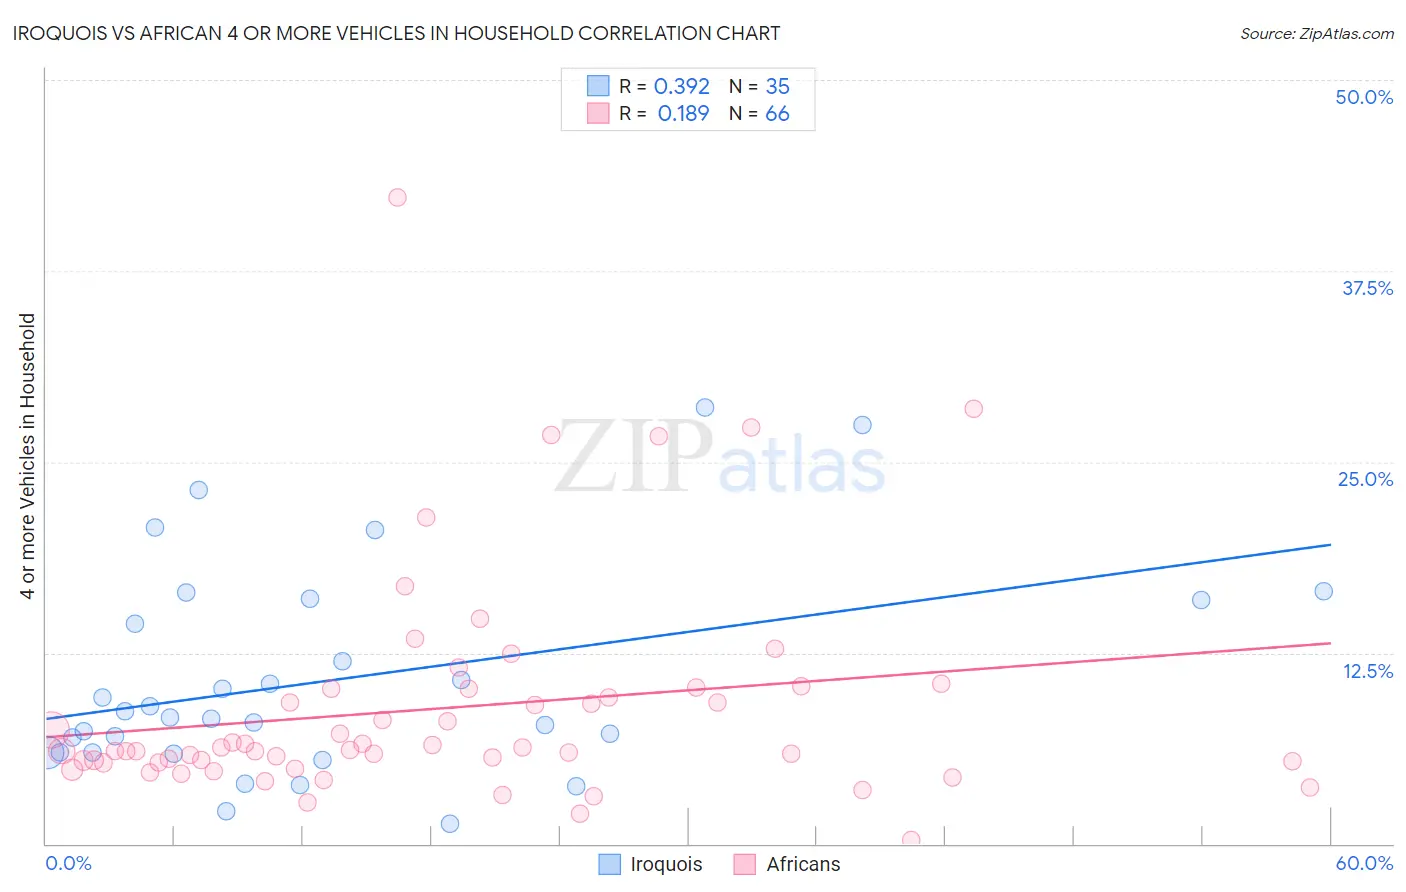
Iroquois vs African 4 or more Vehicles in Household Correlation Chart
The statistical analysis conducted on geographies consisting of 206,658,365 people shows a mild positive correlation between the proportion of Iroquois and percentage of households with 4 or more vehicles available in the United States with a correlation coefficient (R) of 0.392 and weighted average of 6.5%. Similarly, the statistical analysis conducted on geographies consisting of 467,634,971 people shows a poor positive correlation between the proportion of Africans and percentage of households with 4 or more vehicles available in the United States with a correlation coefficient (R) of 0.189 and weighted average of 5.8%, a difference of 10.7%.
4 or more Vehicles in Household Correlation Summary
| Measurement | Iroquois | African |
| Minimum | 1.3% | 0.25% |
| Maximum | 28.6% | 42.3% |
| Range | 27.3% | 42.1% |
| Mean | 10.7% | 8.9% |
| Median | 8.3% | 6.1% |
| Interquartile 25% (IQ1) | 6.0% | 5.4% |
| Interquartile 75% (IQ3) | 15.9% | 10.2% |
| Interquartile Range (IQR) | 9.9% | 4.8% |
| Standard Deviation (Sample) | 6.9% | 7.3% |
| Standard Deviation (Population) | 6.8% | 7.2% |
Similar Demographics by 4 or more Vehicles in Household
Demographics Similar to Iroquois by 4 or more Vehicles in Household
In terms of 4 or more vehicles in household, the demographic groups most similar to Iroquois are Iranian (6.5%, a difference of 0.060%), Central American Indian (6.5%, a difference of 0.080%), Immigrants from Armenia (6.5%, a difference of 0.090%), Peruvian (6.5%, a difference of 0.11%), and Yuman (6.5%, a difference of 0.21%).
| Demographics | Rating | Rank | 4 or more Vehicles in Household |
| Immigrants | Jordan | 73.7 /100 | #148 | Good 6.5% |
| Greeks | 73.6 /100 | #149 | Good 6.5% |
| New Zealanders | 73.3 /100 | #150 | Good 6.5% |
| Immigrants | Hong Kong | 72.2 /100 | #151 | Good 6.5% |
| Yuman | 72.1 /100 | #152 | Good 6.5% |
| Immigrants | Armenia | 71.2 /100 | #153 | Good 6.5% |
| Central American Indians | 71.1 /100 | #154 | Good 6.5% |
| Iroquois | 70.4 /100 | #155 | Good 6.5% |
| Iranians | 69.9 /100 | #156 | Good 6.5% |
| Peruvians | 69.4 /100 | #157 | Good 6.5% |
| Zimbabweans | 67.1 /100 | #158 | Good 6.4% |
| Indians (Asian) | 66.3 /100 | #159 | Good 6.4% |
| Palestinians | 65.8 /100 | #160 | Good 6.4% |
| Immigrants | Cameroon | 64.4 /100 | #161 | Good 6.4% |
| Immigrants | Pakistan | 63.2 /100 | #162 | Good 6.4% |
Demographics Similar to Africans by 4 or more Vehicles in Household
In terms of 4 or more vehicles in household, the demographic groups most similar to Africans are Immigrants from Hungary (5.8%, a difference of 0.020%), Immigrants from Eritrea (5.8%, a difference of 0.030%), Turkish (5.8%, a difference of 0.31%), Immigrants from Belgium (5.8%, a difference of 0.44%), and Immigrants from Australia (5.8%, a difference of 0.53%).
| Demographics | Rating | Rank | 4 or more Vehicles in Household |
| Immigrants | Western Asia | 7.8 /100 | #227 | Tragic 5.9% |
| Immigrants | Uganda | 7.5 /100 | #228 | Tragic 5.9% |
| Eastern Europeans | 6.8 /100 | #229 | Tragic 5.9% |
| Immigrants | Malaysia | 6.7 /100 | #230 | Tragic 5.9% |
| Immigrants | Switzerland | 6.4 /100 | #231 | Tragic 5.9% |
| Immigrants | Argentina | 6.0 /100 | #232 | Tragic 5.9% |
| Sierra Leoneans | 6.0 /100 | #233 | Tragic 5.9% |
| Africans | 4.6 /100 | #234 | Tragic 5.8% |
| Immigrants | Hungary | 4.6 /100 | #235 | Tragic 5.8% |
| Immigrants | Eritrea | 4.5 /100 | #236 | Tragic 5.8% |
| Turks | 4.1 /100 | #237 | Tragic 5.8% |
| Immigrants | Belgium | 4.0 /100 | #238 | Tragic 5.8% |
| Immigrants | Australia | 3.8 /100 | #239 | Tragic 5.8% |
| Immigrants | Poland | 3.8 /100 | #240 | Tragic 5.8% |
| Mongolians | 3.7 /100 | #241 | Tragic 5.8% |