Chippewa vs Immigrants from Singapore Householder Income Under 25 years
COMPARE
Chippewa
Immigrants from Singapore
Householder Income Under 25 years
Householder Income Under 25 years Comparison
Chippewa
Immigrants from Singapore
$47,015
HOUSEHOLDER INCOME UNDER 25 YEARS
0.0/ 100
METRIC RATING
314th/ 347
METRIC RANK
$56,835
HOUSEHOLDER INCOME UNDER 25 YEARS
100.0/ 100
METRIC RATING
24th/ 347
METRIC RANK
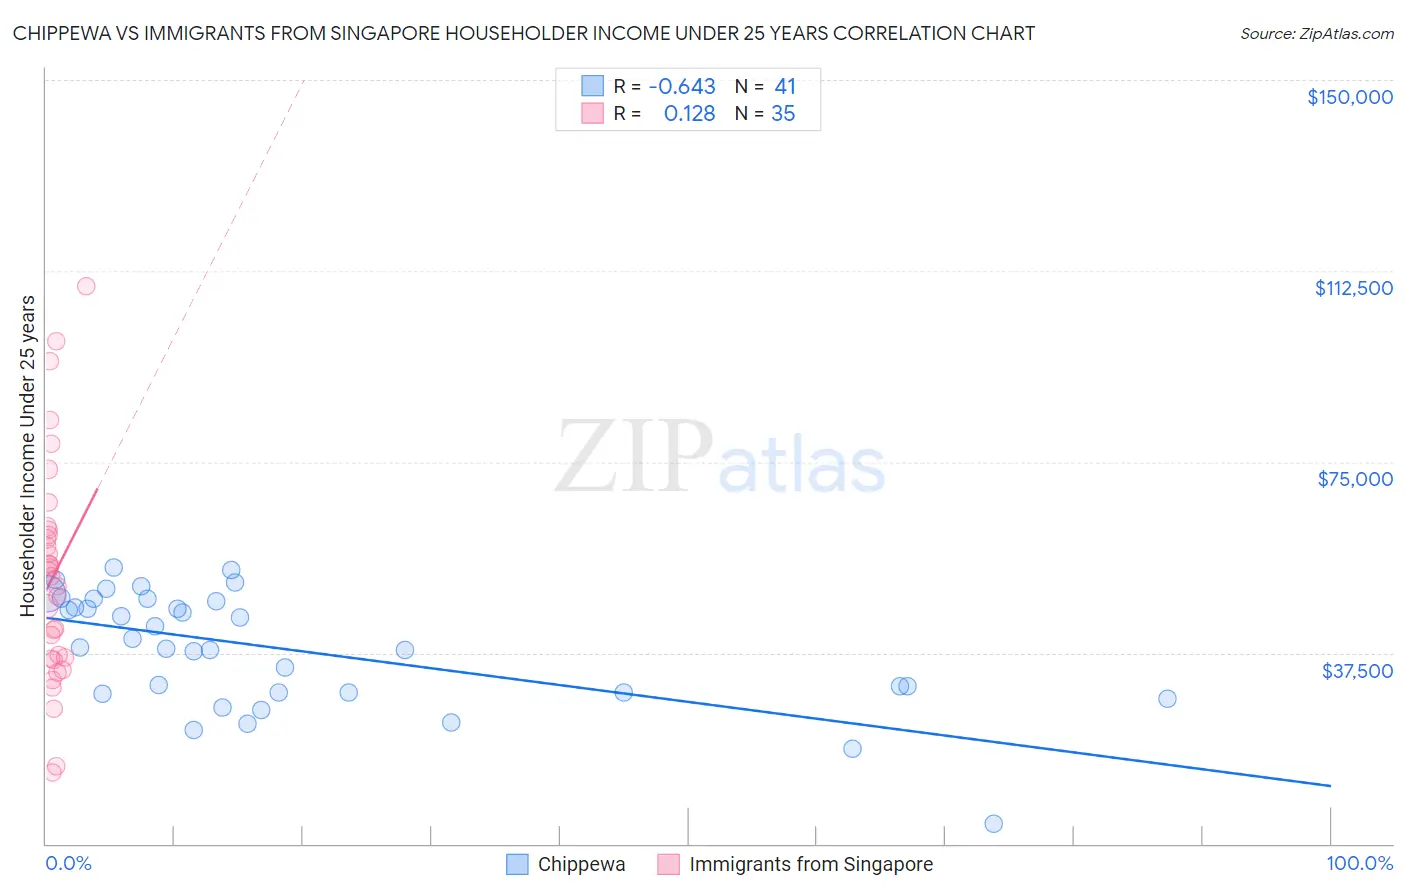
Chippewa vs Immigrants from Singapore Householder Income Under 25 years Correlation Chart
The statistical analysis conducted on geographies consisting of 194,849,027 people shows a significant negative correlation between the proportion of Chippewa and household income with householder under the age of 25 in the United States with a correlation coefficient (R) of -0.643 and weighted average of $47,015. Similarly, the statistical analysis conducted on geographies consisting of 123,473,430 people shows a poor positive correlation between the proportion of Immigrants from Singapore and household income with householder under the age of 25 in the United States with a correlation coefficient (R) of 0.128 and weighted average of $56,835, a difference of 20.9%.
Householder Income Under 25 years Correlation Summary
| Measurement | Chippewa | Immigrants from Singapore |
| Minimum | $3,854 | $14,087 |
| Maximum | $54,149 | $109,471 |
| Range | $50,295 | $95,384 |
| Mean | $38,206 | $52,518 |
| Median | $38,496 | $52,500 |
| Interquartile 25% (IQ1) | $29,766 | $36,250 |
| Interquartile 75% (IQ3) | $47,898 | $61,737 |
| Interquartile Range (IQR) | $18,132 | $25,487 |
| Standard Deviation (Sample) | $11,315 | $21,943 |
| Standard Deviation (Population) | $11,176 | $21,627 |
Similar Demographics by Householder Income Under 25 years
Demographics Similar to Chippewa by Householder Income Under 25 years
In terms of householder income under 25 years, the demographic groups most similar to Chippewa are Crow ($47,012, a difference of 0.010%), Sudanese ($46,982, a difference of 0.070%), Hopi ($46,978, a difference of 0.080%), Spanish American ($46,913, a difference of 0.22%), and Delaware ($47,159, a difference of 0.31%).
| Demographics | Rating | Rank | Householder Income Under 25 years |
| Bangladeshis | 0.0 /100 | #307 | Tragic $47,589 |
| Comanche | 0.0 /100 | #308 | Tragic $47,518 |
| U.S. Virgin Islanders | 0.0 /100 | #309 | Tragic $47,448 |
| Iroquois | 0.0 /100 | #310 | Tragic $47,380 |
| Ottawa | 0.0 /100 | #311 | Tragic $47,366 |
| Bermudans | 0.0 /100 | #312 | Tragic $47,359 |
| Delaware | 0.0 /100 | #313 | Tragic $47,159 |
| Chippewa | 0.0 /100 | #314 | Tragic $47,015 |
| Crow | 0.0 /100 | #315 | Tragic $47,012 |
| Sudanese | 0.0 /100 | #316 | Tragic $46,982 |
| Hopi | 0.0 /100 | #317 | Tragic $46,978 |
| Spanish Americans | 0.0 /100 | #318 | Tragic $46,913 |
| Africans | 0.0 /100 | #319 | Tragic $46,838 |
| Immigrants | Sudan | 0.0 /100 | #320 | Tragic $46,791 |
| Potawatomi | 0.0 /100 | #321 | Tragic $46,462 |
Demographics Similar to Immigrants from Singapore by Householder Income Under 25 years
In terms of householder income under 25 years, the demographic groups most similar to Immigrants from Singapore are Immigrants from Pakistan ($56,789, a difference of 0.080%), Tongan ($56,972, a difference of 0.24%), Asian ($57,003, a difference of 0.29%), Immigrants from Australia ($56,660, a difference of 0.31%), and Immigrants from Ireland ($57,075, a difference of 0.42%).
| Demographics | Rating | Rank | Householder Income Under 25 years |
| Sierra Leoneans | 100.0 /100 | #17 | Exceptional $57,272 |
| Immigrants | Eastern Asia | 100.0 /100 | #18 | Exceptional $57,123 |
| Bhutanese | 100.0 /100 | #19 | Exceptional $57,078 |
| Immigrants | Ireland | 100.0 /100 | #20 | Exceptional $57,075 |
| Immigrants | Fiji | 100.0 /100 | #21 | Exceptional $57,074 |
| Asians | 100.0 /100 | #22 | Exceptional $57,003 |
| Tongans | 100.0 /100 | #23 | Exceptional $56,972 |
| Immigrants | Singapore | 100.0 /100 | #24 | Exceptional $56,835 |
| Immigrants | Pakistan | 100.0 /100 | #25 | Exceptional $56,789 |
| Immigrants | Australia | 100.0 /100 | #26 | Exceptional $56,660 |
| Immigrants | North Macedonia | 100.0 /100 | #27 | Exceptional $56,503 |
| Immigrants | Peru | 100.0 /100 | #28 | Exceptional $56,384 |
| Immigrants | Asia | 100.0 /100 | #29 | Exceptional $56,379 |
| Immigrants | Moldova | 100.0 /100 | #30 | Exceptional $56,168 |
| Vietnamese | 100.0 /100 | #31 | Exceptional $56,127 |