Chinese vs Ottawa 2 or more Vehicles in Household
COMPARE
Chinese
Ottawa
2 or more Vehicles in Household
2 or more Vehicles in Household Comparison
Chinese
Ottawa
60.1%
2 OR MORE VEHICLES IN HOUSEHOLD
100.0/ 100
METRIC RATING
36th/ 347
METRIC RANK
57.9%
2 OR MORE VEHICLES IN HOUSEHOLD
99.0/ 100
METRIC RATING
93rd/ 347
METRIC RANK
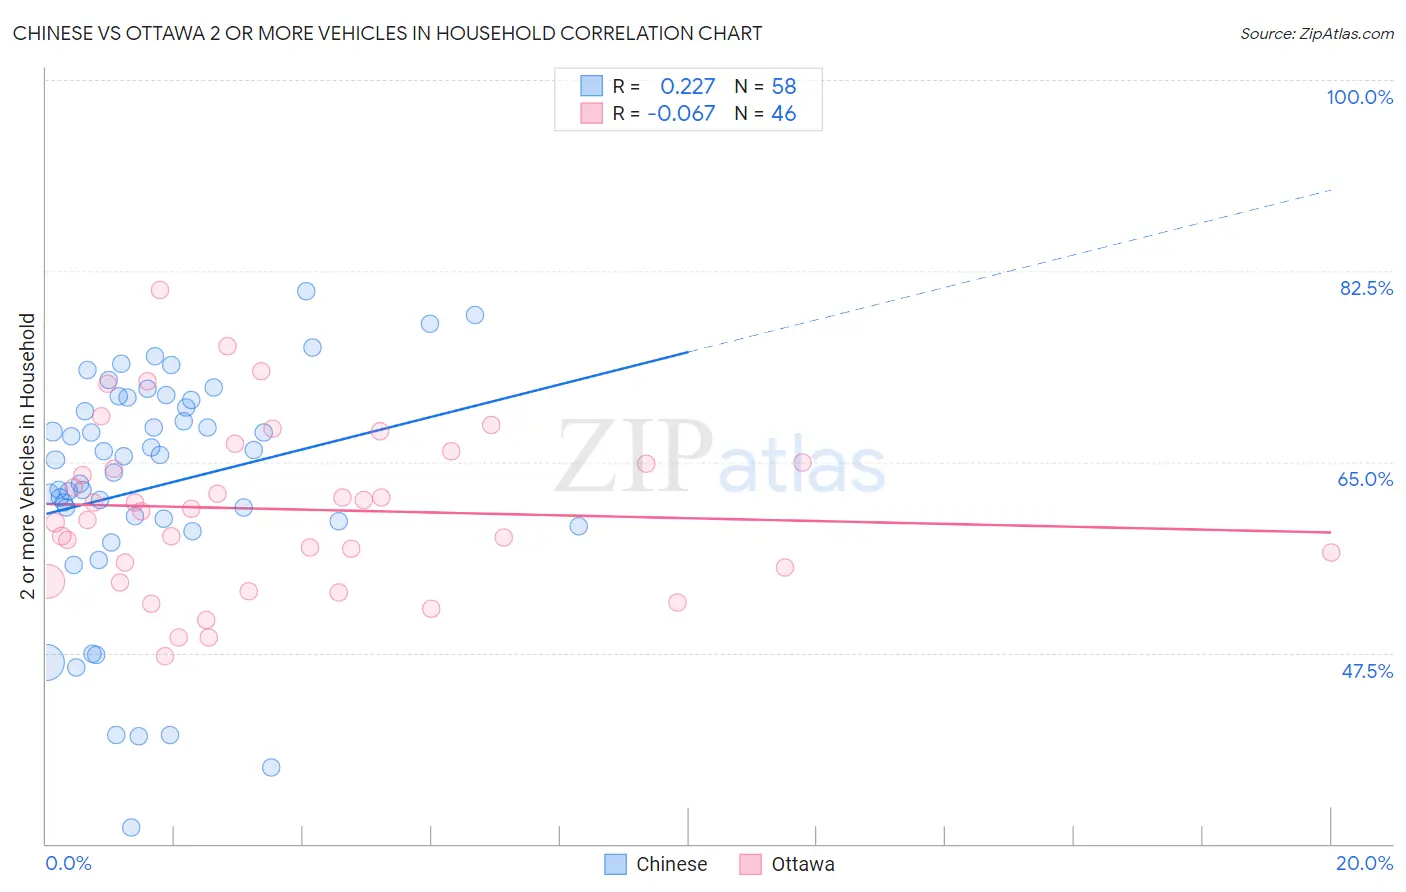
Chinese vs Ottawa 2 or more Vehicles in Household Correlation Chart
The statistical analysis conducted on geographies consisting of 64,802,428 people shows a weak positive correlation between the proportion of Chinese and percentage of households with 2 or more vehicles available in the United States with a correlation coefficient (R) of 0.227 and weighted average of 60.1%. Similarly, the statistical analysis conducted on geographies consisting of 49,944,336 people shows a slight negative correlation between the proportion of Ottawa and percentage of households with 2 or more vehicles available in the United States with a correlation coefficient (R) of -0.067 and weighted average of 57.9%, a difference of 3.9%.
2 or more Vehicles in Household Correlation Summary
| Measurement | Chinese | Ottawa |
| Minimum | 31.5% | 47.2% |
| Maximum | 80.6% | 80.8% |
| Range | 49.2% | 33.5% |
| Mean | 62.8% | 60.7% |
| Median | 65.3% | 60.6% |
| Interquartile 25% (IQ1) | 59.5% | 55.3% |
| Interquartile 75% (IQ3) | 70.6% | 65.0% |
| Interquartile Range (IQR) | 11.1% | 9.7% |
| Standard Deviation (Sample) | 10.9% | 7.5% |
| Standard Deviation (Population) | 10.8% | 7.4% |
Similar Demographics by 2 or more Vehicles in Household
Demographics Similar to Chinese by 2 or more Vehicles in Household
In terms of 2 or more vehicles in household, the demographic groups most similar to Chinese are Immigrants from Philippines (60.1%, a difference of 0.020%), Irish (60.1%, a difference of 0.030%), American (60.0%, a difference of 0.10%), British (60.0%, a difference of 0.10%), and Spanish (60.2%, a difference of 0.14%).
| Demographics | Rating | Rank | 2 or more Vehicles in Household |
| Hawaiians | 100.0 /100 | #29 | Exceptional 60.4% |
| Finns | 100.0 /100 | #30 | Exceptional 60.3% |
| Spanish American Indians | 100.0 /100 | #31 | Exceptional 60.3% |
| Arapaho | 100.0 /100 | #32 | Exceptional 60.2% |
| Immigrants | Mexico | 100.0 /100 | #33 | Exceptional 60.2% |
| Spanish | 100.0 /100 | #34 | Exceptional 60.2% |
| Immigrants | Philippines | 100.0 /100 | #35 | Exceptional 60.1% |
| Chinese | 100.0 /100 | #36 | Exceptional 60.1% |
| Irish | 100.0 /100 | #37 | Exceptional 60.1% |
| Americans | 100.0 /100 | #38 | Exceptional 60.0% |
| British | 100.0 /100 | #39 | Exceptional 60.0% |
| Cherokee | 100.0 /100 | #40 | Exceptional 59.9% |
| Northern Europeans | 100.0 /100 | #41 | Exceptional 59.9% |
| Malaysians | 100.0 /100 | #42 | Exceptional 59.8% |
| Czechoslovakians | 100.0 /100 | #43 | Exceptional 59.8% |
Demographics Similar to Ottawa by 2 or more Vehicles in Household
In terms of 2 or more vehicles in household, the demographic groups most similar to Ottawa are Shoshone (57.9%, a difference of 0.0%), Pakistani (57.9%, a difference of 0.030%), Immigrants from Germany (57.9%, a difference of 0.060%), Hispanic or Latino (57.9%, a difference of 0.060%), and Filipino (57.8%, a difference of 0.060%).
| Demographics | Rating | Rank | 2 or more Vehicles in Household |
| Potawatomi | 99.1 /100 | #86 | Exceptional 58.0% |
| Thais | 99.1 /100 | #87 | Exceptional 57.9% |
| Immigrants | Iran | 99.1 /100 | #88 | Exceptional 57.9% |
| Immigrants | Germany | 99.0 /100 | #89 | Exceptional 57.9% |
| Hispanics or Latinos | 99.0 /100 | #90 | Exceptional 57.9% |
| Pakistanis | 99.0 /100 | #91 | Exceptional 57.9% |
| Shoshone | 99.0 /100 | #92 | Exceptional 57.9% |
| Ottawa | 99.0 /100 | #93 | Exceptional 57.9% |
| Filipinos | 98.9 /100 | #94 | Exceptional 57.8% |
| Hmong | 98.9 /100 | #95 | Exceptional 57.8% |
| Burmese | 98.8 /100 | #96 | Exceptional 57.8% |
| Slavs | 98.8 /100 | #97 | Exceptional 57.8% |
| Palestinians | 98.6 /100 | #98 | Exceptional 57.7% |
| Cajuns | 98.5 /100 | #99 | Exceptional 57.7% |
| Fijians | 98.4 /100 | #100 | Exceptional 57.6% |