Chinese vs Costa Rican 2 or more Vehicles in Household
COMPARE
Chinese
Costa Rican
2 or more Vehicles in Household
2 or more Vehicles in Household Comparison
Chinese
Costa Ricans
60.1%
2 OR MORE VEHICLES IN HOUSEHOLD
100.0/ 100
METRIC RATING
36th/ 347
METRIC RANK
56.9%
2 OR MORE VEHICLES IN HOUSEHOLD
94.7/ 100
METRIC RATING
120th/ 347
METRIC RANK
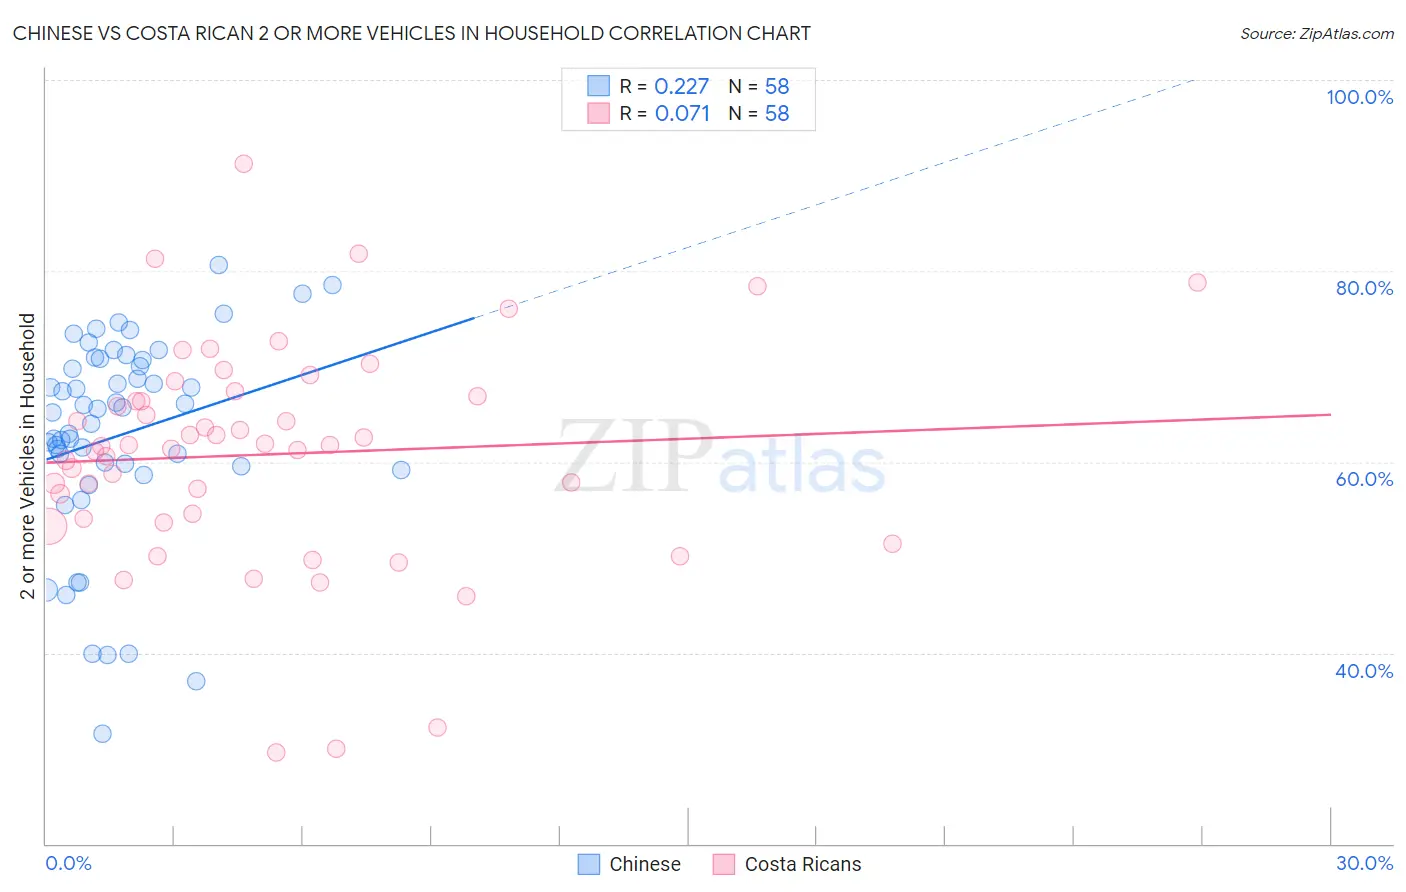
Chinese vs Costa Rican 2 or more Vehicles in Household Correlation Chart
The statistical analysis conducted on geographies consisting of 64,802,428 people shows a weak positive correlation between the proportion of Chinese and percentage of households with 2 or more vehicles available in the United States with a correlation coefficient (R) of 0.227 and weighted average of 60.1%. Similarly, the statistical analysis conducted on geographies consisting of 253,480,816 people shows a slight positive correlation between the proportion of Costa Ricans and percentage of households with 2 or more vehicles available in the United States with a correlation coefficient (R) of 0.071 and weighted average of 56.9%, a difference of 5.5%.
2 or more Vehicles in Household Correlation Summary
| Measurement | Chinese | Costa Rican |
| Minimum | 31.5% | 29.5% |
| Maximum | 80.6% | 91.2% |
| Range | 49.2% | 61.7% |
| Mean | 62.8% | 60.8% |
| Median | 65.3% | 61.7% |
| Interquartile 25% (IQ1) | 59.5% | 54.0% |
| Interquartile 75% (IQ3) | 70.6% | 66.8% |
| Interquartile Range (IQR) | 11.1% | 12.8% |
| Standard Deviation (Sample) | 10.9% | 11.7% |
| Standard Deviation (Population) | 10.8% | 11.6% |
Similar Demographics by 2 or more Vehicles in Household
Demographics Similar to Chinese by 2 or more Vehicles in Household
In terms of 2 or more vehicles in household, the demographic groups most similar to Chinese are Immigrants from Philippines (60.1%, a difference of 0.020%), Irish (60.1%, a difference of 0.030%), American (60.0%, a difference of 0.10%), British (60.0%, a difference of 0.10%), and Spanish (60.2%, a difference of 0.14%).
| Demographics | Rating | Rank | 2 or more Vehicles in Household |
| Hawaiians | 100.0 /100 | #29 | Exceptional 60.4% |
| Finns | 100.0 /100 | #30 | Exceptional 60.3% |
| Spanish American Indians | 100.0 /100 | #31 | Exceptional 60.3% |
| Arapaho | 100.0 /100 | #32 | Exceptional 60.2% |
| Immigrants | Mexico | 100.0 /100 | #33 | Exceptional 60.2% |
| Spanish | 100.0 /100 | #34 | Exceptional 60.2% |
| Immigrants | Philippines | 100.0 /100 | #35 | Exceptional 60.1% |
| Chinese | 100.0 /100 | #36 | Exceptional 60.1% |
| Irish | 100.0 /100 | #37 | Exceptional 60.1% |
| Americans | 100.0 /100 | #38 | Exceptional 60.0% |
| British | 100.0 /100 | #39 | Exceptional 60.0% |
| Cherokee | 100.0 /100 | #40 | Exceptional 59.9% |
| Northern Europeans | 100.0 /100 | #41 | Exceptional 59.9% |
| Malaysians | 100.0 /100 | #42 | Exceptional 59.8% |
| Czechoslovakians | 100.0 /100 | #43 | Exceptional 59.8% |
Demographics Similar to Costa Ricans by 2 or more Vehicles in Household
In terms of 2 or more vehicles in household, the demographic groups most similar to Costa Ricans are Native/Alaskan (57.0%, a difference of 0.050%), Asian (57.0%, a difference of 0.070%), Sioux (56.8%, a difference of 0.17%), Iraqi (57.1%, a difference of 0.24%), and Immigrants from South Africa (56.7%, a difference of 0.37%).
| Demographics | Rating | Rank | 2 or more Vehicles in Household |
| Zimbabweans | 96.9 /100 | #113 | Exceptional 57.2% |
| Immigrants | Lebanon | 96.8 /100 | #114 | Exceptional 57.2% |
| Chippewa | 96.6 /100 | #115 | Exceptional 57.2% |
| Immigrants | Jordan | 96.6 /100 | #116 | Exceptional 57.2% |
| Iraqis | 95.8 /100 | #117 | Exceptional 57.1% |
| Asians | 95.1 /100 | #118 | Exceptional 57.0% |
| Natives/Alaskans | 95.0 /100 | #119 | Exceptional 57.0% |
| Costa Ricans | 94.7 /100 | #120 | Exceptional 56.9% |
| Sioux | 93.8 /100 | #121 | Exceptional 56.8% |
| Immigrants | South Africa | 92.5 /100 | #122 | Exceptional 56.7% |
| Australians | 91.8 /100 | #123 | Exceptional 56.7% |
| New Zealanders | 91.8 /100 | #124 | Exceptional 56.7% |
| Tsimshian | 91.6 /100 | #125 | Exceptional 56.7% |
| Estonians | 90.9 /100 | #126 | Exceptional 56.6% |
| Immigrants | Thailand | 90.7 /100 | #127 | Exceptional 56.6% |