Chilean vs Navajo 2 or more Vehicles in Household

COMPARE

Chilean
Race
Ancestry
AfghanAfricanAlaska NativeAlaskan AthabascanAlbanianAleutAlsatianAmericanApacheArabArapahoArgentineanArmenianAssyrian/Chaldean/SyriacAustralianAustrianBahamianBangladeshiBarbadianBasqueBelgianBelizeanBermudanBhutaneseBlackfeetBolivianBrazilianBritishBritish West IndianBulgarianBurmeseCajunCambodianCanadianCape VerdeanCarpatho RusynCelticCentral AmericanCentral American IndianCherokeeCheyenneChickasawChileanChineseChippewaChoctawColombianColvilleComancheCosta RicanCreeCreekCroatianCrowCubanCypriotCzechCzechoslovakianDanishDelawareDominicanDutchDutch West IndianEastern EuropeanEcuadorianEgyptianEnglishEstonianEthiopianEuropeanFijianFilipinoFinnishFrenchFrench American IndianFrench CanadianGermanGerman RussianGhanaianGreekGuamanian/ChamorroGuatemalanGuyaneseHaitianHmongHonduranHopiHoumaHungarianIcelanderIndian (Asian)IndonesianInupiatIranianIraqiIrishIroquoisIsraeliItalianJamaicanJapaneseJordanianKenyanKiowaKoreanLaotianLatvianLebaneseLiberianLithuanianLumbeeLuxembourgerMacedonianMalaysianMalteseMarshalleseMenomineeMexicanMexican American IndianMongolianMoroccanNative HawaiianNepaleseNew ZealanderNicaraguanNigerianNorthern EuropeanNorwegianOkinawanOsageOttawaPaiutePakistaniPalestinianPanamanianParaguayanPennsylvania GermanPeruvianPimaPolishPortuguesePotawatomiPuebloPuerto RicanPuget Sound SalishRomanianRussianSalvadoranSamoanScandinavianScotch-IrishScottishSeminoleSenegaleseSerbianShoshoneSierra LeoneanSiouxSlavicSlovakSloveneSomaliSouth AfricanSouth AmericanSouth American IndianSoviet UnionSpaniardSpanishSpanish AmericanSpanish American IndianSri LankanSubsaharan AfricanSudaneseSwedishSwissSyrianTaiwaneseThaiTlingit-HaidaTohono O'OdhamTonganTrinidadian and TobagonianTsimshianTurkishU.S. Virgin IslanderUgandanUkrainianUruguayanUteVenezuelanVietnameseWelshWest IndianYakamaYaquiYugoslavianYumanYup'ikZimbabwean
Immigration
NonimmigrantsImmigrantsAfghanistanAfricaAlbaniaArgentinaArmeniaAsiaAustraliaAustriaBahamasBangladeshBarbadosBelarusBelgiumBelizeBoliviaBosnia and HerzegovinaBrazilBulgariaBurma/MyanmarCabo VerdeCambodiaCameroonCanadaCaribbeanCentral AmericaChileChinaColombiaCongoCosta RicaCroatiaCubaCzechoslovakiaDenmarkDominicaDominican RepublicEastern AfricaEastern AsiaEastern EuropeEcuadorEgyptEl SalvadorEnglandEritreaEthiopiaEuropeFijiFranceGermanyGhanaGreeceGrenadaGuatemalaGuyanaHaitiHondurasHong KongHungaryIndiaIndonesiaIranIraqIrelandIsraelItalyJamaicaJapanJordanKazakhstanKenyaKoreaKuwaitLaosLatin AmericaLatviaLebanonLiberiaLithuaniaMalaysiaMexicoMicronesiaMiddle AfricaMoldovaMoroccoNepalNetherlandsNicaraguaNigeriaNorth AmericaNorth MacedoniaNorthern AfricaNorthern EuropeNorwayOceaniaPakistanPanamaPeruPhilippinesPolandPortugalRomaniaRussiaSaudi ArabiaScotlandSenegalSerbiaSierra LeoneSingaporeSomaliaSouth AfricaSouth AmericaSouth Central AsiaSouth Eastern AsiaSouthern EuropeSpainSri LankaSt. Vincent and the GrenadinesSudanSwedenSwitzerlandSyriaTaiwanThailandTrinidad and TobagoTurkeyUgandaUkraineUruguayUzbekistanVenezuelaVietnamWest IndiesWestern AfricaWestern AsiaWestern EuropeYemenZaireZimbabweAzores
Navajo
Race
Ancestry
AfghanAfricanAlaska NativeAlaskan AthabascanAlbanianAleutAlsatianAmericanApacheArabArapahoArgentineanArmenianAssyrian/Chaldean/SyriacAustralianAustrianBahamianBangladeshiBarbadianBasqueBelgianBelizeanBermudanBhutaneseBlackfeetBolivianBrazilianBritishBritish West IndianBulgarianBurmeseCajunCambodianCanadianCape VerdeanCarpatho RusynCelticCentral AmericanCentral American IndianCherokeeCheyenneChickasawChineseChippewaChoctawColombianColvilleComancheCosta RicanCreeCreekCroatianCrowCubanCypriotCzechCzechoslovakianDanishDelawareDominicanDutchDutch West IndianEastern EuropeanEcuadorianEgyptianEnglishEstonianEthiopianEuropeanFijianFilipinoFinnishFrenchFrench American IndianFrench CanadianGermanGerman RussianGhanaianGreekGuamanian/ChamorroGuatemalanGuyaneseHaitianHmongHonduranHopiHoumaHungarianIcelanderIndian (Asian)IndonesianInupiatIranianIraqiIrishIroquoisIsraeliItalianJamaicanJapaneseJordanianKenyanKiowaKoreanLaotianLatvianLebaneseLiberianLithuanianLumbeeLuxembourgerMacedonianMalaysianMalteseMarshalleseMenomineeMexicanMexican American IndianMongolianMoroccanNative HawaiianNavajoNepaleseNew ZealanderNicaraguanNigerianNorthern EuropeanNorwegianOkinawanOsageOttawaPaiutePakistaniPalestinianPanamanianParaguayanPennsylvania GermanPeruvianPimaPolishPortuguesePotawatomiPuebloPuerto RicanPuget Sound SalishRomanianRussianSalvadoranSamoanScandinavianScotch-IrishScottishSeminoleSenegaleseSerbianShoshoneSierra LeoneanSiouxSlavicSlovakSloveneSomaliSouth AfricanSouth AmericanSouth American IndianSoviet UnionSpaniardSpanishSpanish AmericanSpanish American IndianSri LankanSubsaharan AfricanSudaneseSwedishSwissSyrianTaiwaneseThaiTlingit-HaidaTohono O'OdhamTonganTrinidadian and TobagonianTsimshianTurkishU.S. Virgin IslanderUgandanUkrainianUruguayanUteVenezuelanVietnameseWelshWest IndianYakamaYaquiYugoslavianYumanYup'ikZimbabwean
Immigration
NonimmigrantsImmigrantsAfghanistanAfricaAlbaniaArgentinaArmeniaAsiaAustraliaAustriaBahamasBangladeshBarbadosBelarusBelgiumBelizeBoliviaBosnia and HerzegovinaBrazilBulgariaBurma/MyanmarCabo VerdeCambodiaCameroonCanadaCaribbeanCentral AmericaChileChinaColombiaCongoCosta RicaCroatiaCubaCzechoslovakiaDenmarkDominicaDominican RepublicEastern AfricaEastern AsiaEastern EuropeEcuadorEgyptEl SalvadorEnglandEritreaEthiopiaEuropeFijiFranceGermanyGhanaGreeceGrenadaGuatemalaGuyanaHaitiHondurasHong KongHungaryIndiaIndonesiaIranIraqIrelandIsraelItalyJamaicaJapanJordanKazakhstanKenyaKoreaKuwaitLaosLatin AmericaLatviaLebanonLiberiaLithuaniaMalaysiaMexicoMicronesiaMiddle AfricaMoldovaMoroccoNepalNetherlandsNicaraguaNigeriaNorth AmericaNorth MacedoniaNorthern AfricaNorthern EuropeNorwayOceaniaPakistanPanamaPeruPhilippinesPolandPortugalRomaniaRussiaSaudi ArabiaScotlandSenegalSerbiaSierra LeoneSingaporeSomaliaSouth AfricaSouth AmericaSouth Central AsiaSouth Eastern AsiaSouthern EuropeSpainSri LankaSt. Vincent and the GrenadinesSudanSwedenSwitzerlandSyriaTaiwanThailandTrinidad and TobagoTurkeyUgandaUkraineUruguayUzbekistanVenezuelaVietnamWest IndiesWestern AfricaWestern AsiaWestern EuropeYemenZaireZimbabweAzores
2 or more Vehicles in Household
Income
Poverty
Unemployment
Labor Participation
Family Structure
Vehicle Availability
Education Level
Disability

2 or more Vehicles in Household Comparison

Chileans

Navajo

Excellent
Average
56.1%
2 OR MORE VEHICLES IN HOUSEHOLD
80.2/ 100
METRIC RATING
149th/ 347
METRIC RANK
55.3%
2 OR MORE VEHICLES IN HOUSEHOLD
50.0/ 100
METRIC RATING
174th/ 347
METRIC RANK

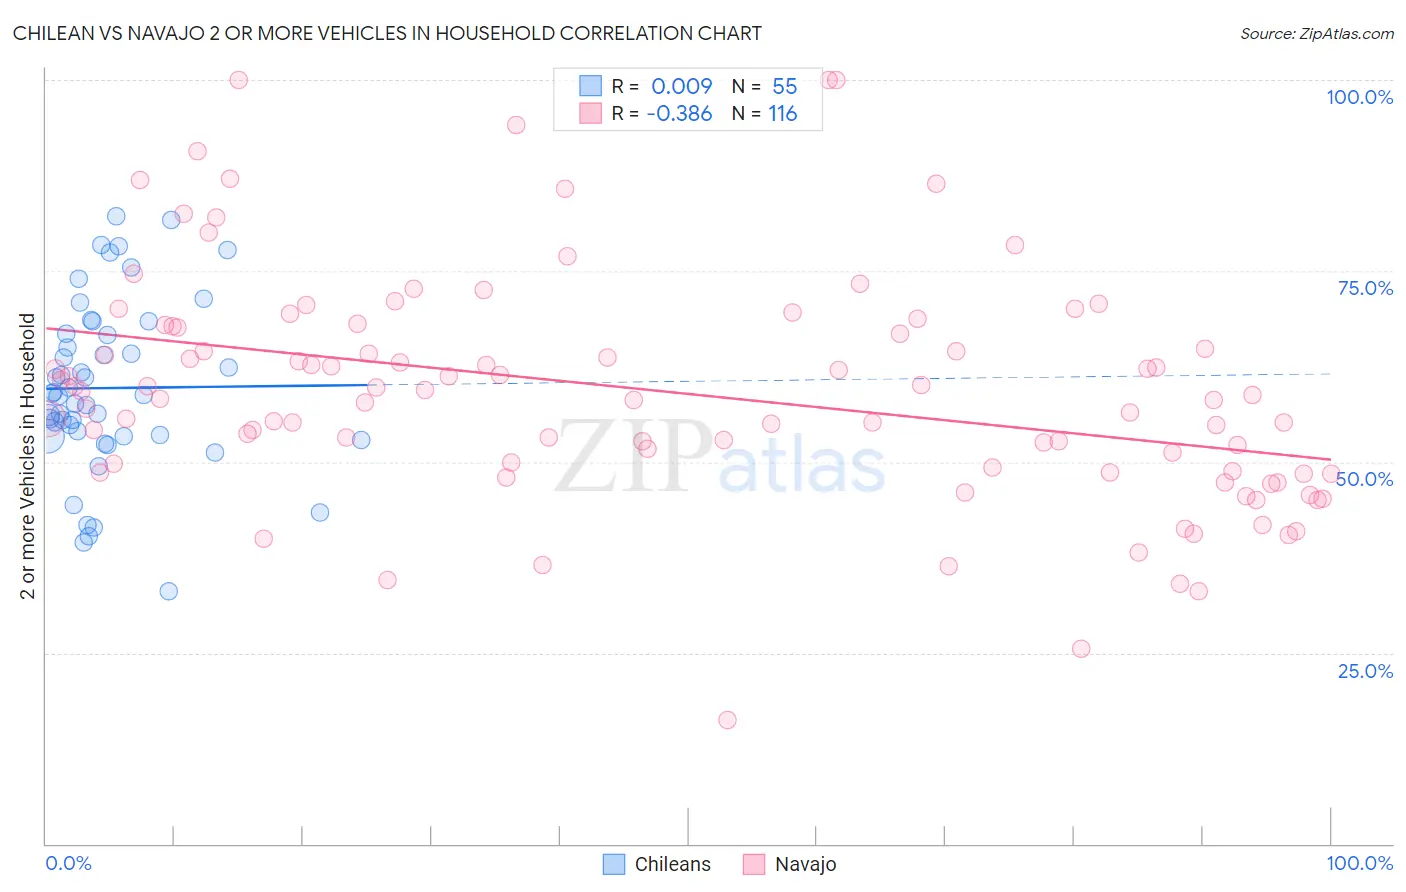
Chilean vs Navajo 2 or more Vehicles in Household Correlation Chart

The statistical analysis conducted on geographies consisting of 256,591,468 people shows no correlation between the proportion of Chileans and percentage of households with 2 or more vehicles available in the United States with a correlation coefficient (R) of 0.009 and weighted average of 56.1%. Similarly, the statistical analysis conducted on geographies consisting of 224,763,782 people shows a mild negative correlation between the proportion of Navajo and percentage of households with 2 or more vehicles available in the United States with a correlation coefficient (R) of -0.386 and weighted average of 55.3%, a difference of 1.4%.
Chilean vs Navajo 2 or more Vehicles in Household

2 or more Vehicles in Household Correlation Summary

MeasurementChileanNavajo
Minimum33.1%16.3%
Maximum82.2%100.0%
Range49.1%83.7%
Mean59.7%59.2%
Median58.8%58.5%
Interquartile 25% (IQ1)53.3%49.0%
Interquartile 75% (IQ3)66.7%67.7%
Interquartile Range (IQR)13.4%18.7%
Standard Deviation (Sample)11.2%15.1%
Standard Deviation (Population)11.1%15.1%

Similar Demographics by 2 or more Vehicles in Household

Demographics Similar to Chileans by 2 or more Vehicles in Household

In terms of 2 or more vehicles in household, the demographic groups most similar to Chileans are Immigrants from Moldova (56.1%, a difference of 0.0%), Serbian (56.1%, a difference of 0.010%), Nicaraguan (56.1%, a difference of 0.020%), Venezuelan (56.1%, a difference of 0.030%), and Syrian (56.2%, a difference of 0.060%).
DemographicsRating | Rank2 or more Vehicles in Household
South Africans
83.1
/100
|
#142
Excellent
56.2%
Seminole
81.7
/100
|
#143
Excellent
56.2%
Immigrants | Syria
81.4
/100
|
#144
Excellent
56.2%
Syrians
81.2
/100
|
#145
Excellent
56.2%
Venezuelans
80.7
/100
|
#146
Excellent
56.1%
Serbians
80.3
/100
|
#147
Excellent
56.1%
Immigrants | Moldova
80.2
/100
|
#148
Excellent
56.1%
Chileans
80.2
/100
|
#149
Excellent
56.1%
Nicaraguans
79.9
/100
|
#150
Good
56.1%
Immigrants | Northern Europe
78.7
/100
|
#151
Good
56.1%
Immigrants | Pakistan
78.1
/100
|
#152
Good
56.1%
Lumbee
71.9
/100
|
#153
Good
55.9%
Ukrainians
70.8
/100
|
#154
Good
55.8%
Immigrants | Venezuela
70.7
/100
|
#155
Good
55.8%
Immigrants | Lithuania
70.4
/100
|
#156
Good
55.8%

Demographics Similar to Navajo by 2 or more Vehicles in Household

In terms of 2 or more vehicles in household, the demographic groups most similar to Navajo are Immigrants from Denmark (55.3%, a difference of 0.020%), Immigrants from Western Europe (55.4%, a difference of 0.050%), Immigrants from Nicaragua (55.4%, a difference of 0.070%), Immigrants from Cuba (55.3%, a difference of 0.12%), and Menominee (55.3%, a difference of 0.15%).
DemographicsRating | Rank2 or more Vehicles in Household
Kenyans
58.1
/100
|
#167
Average
55.5%
French American Indians
56.7
/100
|
#168
Average
55.5%
Immigrants | Austria
56.3
/100
|
#169
Average
55.5%
Romanians
55.8
/100
|
#170
Average
55.5%
Immigrants | Costa Rica
54.4
/100
|
#171
Average
55.4%
Immigrants | Nicaragua
51.6
/100
|
#172
Average
55.4%
Immigrants | Western Europe
51.4
/100
|
#173
Average
55.4%
Navajo
50.0
/100
|
#174
Average
55.3%
Immigrants | Denmark
49.4
/100
|
#175
Average
55.3%
Immigrants | Cuba
47.0
/100
|
#176
Average
55.3%
Menominee
46.2
/100
|
#177
Average
55.3%
Immigrants | Sweden
45.3
/100
|
#178
Average
55.2%
Alaskan Athabascans
42.9
/100
|
#179
Average
55.2%
Immigrants | Kenya
40.4
/100
|
#180
Average
55.1%
Immigrants | Micronesia
38.2
/100
|
#181
Fair
55.1%