Dutch West Indian vs Navajo 2 or more Vehicles in Household
COMPARE
Dutch West Indian
Navajo
2 or more Vehicles in Household
2 or more Vehicles in Household Comparison
Dutch West Indians
Navajo
55.6%
2 OR MORE VEHICLES IN HOUSEHOLD
59.8/ 100
METRIC RATING
164th/ 347
METRIC RANK
55.3%
2 OR MORE VEHICLES IN HOUSEHOLD
50.0/ 100
METRIC RATING
174th/ 347
METRIC RANK
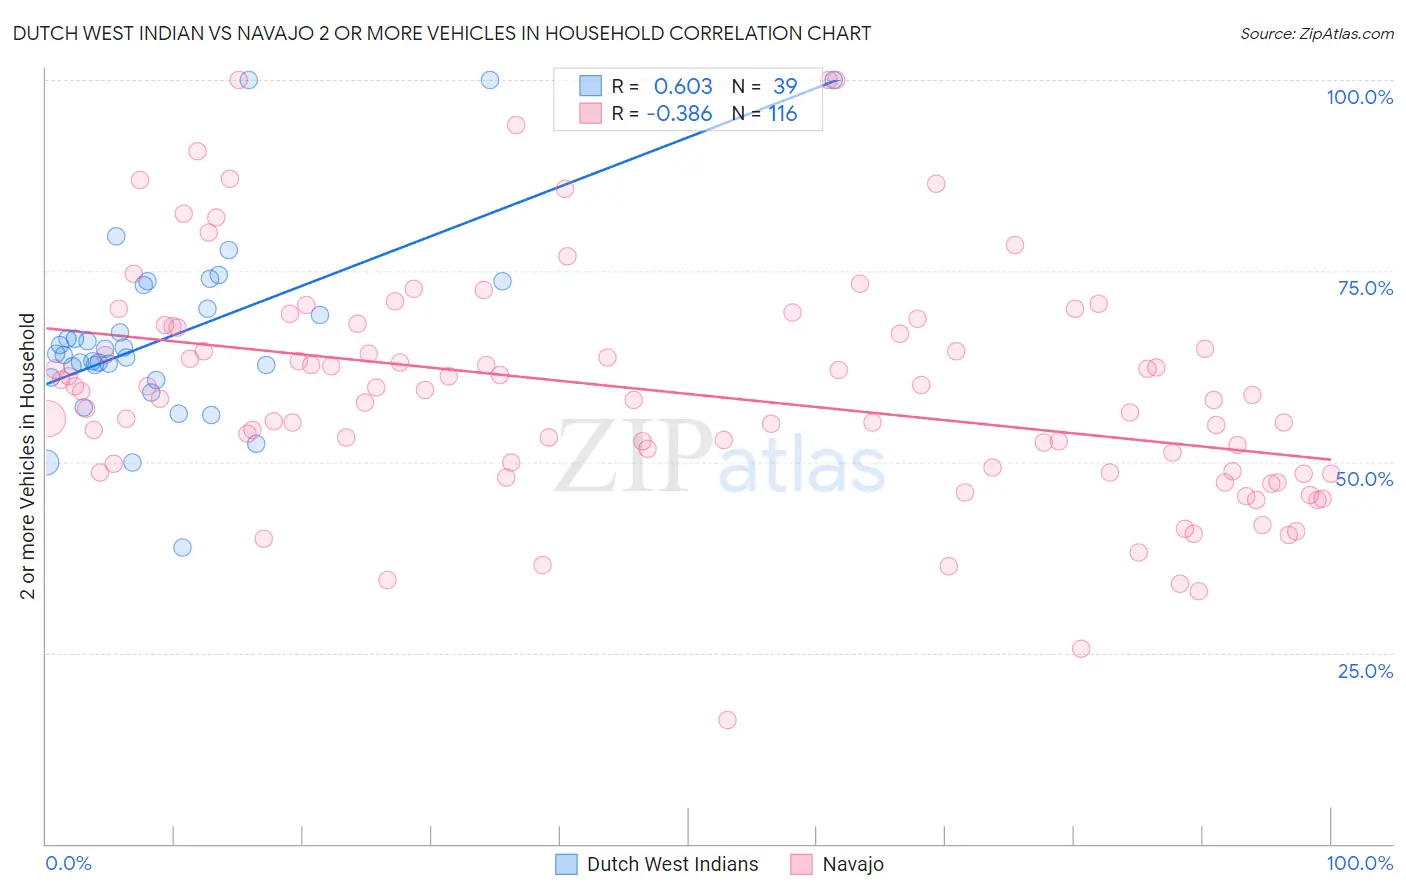
Dutch West Indian vs Navajo 2 or more Vehicles in Household Correlation Chart
The statistical analysis conducted on geographies consisting of 85,766,577 people shows a significant positive correlation between the proportion of Dutch West Indians and percentage of households with 2 or more vehicles available in the United States with a correlation coefficient (R) of 0.603 and weighted average of 55.6%. Similarly, the statistical analysis conducted on geographies consisting of 224,763,782 people shows a mild negative correlation between the proportion of Navajo and percentage of households with 2 or more vehicles available in the United States with a correlation coefficient (R) of -0.386 and weighted average of 55.3%, a difference of 0.40%.
2 or more Vehicles in Household Correlation Summary
| Measurement | Dutch West Indian | Navajo |
| Minimum | 38.7% | 16.3% |
| Maximum | 100.0% | 100.0% |
| Range | 61.3% | 83.7% |
| Mean | 66.6% | 59.2% |
| Median | 64.1% | 58.5% |
| Interquartile 25% (IQ1) | 61.1% | 49.0% |
| Interquartile 75% (IQ3) | 73.2% | 67.7% |
| Interquartile Range (IQR) | 12.1% | 18.7% |
| Standard Deviation (Sample) | 12.6% | 15.1% |
| Standard Deviation (Population) | 12.4% | 15.1% |
Demographics Similar to Dutch West Indians and Navajo by 2 or more Vehicles in Household
In terms of 2 or more vehicles in household, the demographic groups most similar to Dutch West Indians are Immigrants from Zimbabwe (55.6%, a difference of 0.010%), Immigrants from El Salvador (55.6%, a difference of 0.020%), German Russian (55.6%, a difference of 0.040%), Colville (55.6%, a difference of 0.050%), and Immigrants from Sri Lanka (55.5%, a difference of 0.060%). Similarly, the demographic groups most similar to Navajo are Immigrants from Denmark (55.3%, a difference of 0.020%), Immigrants from Western Europe (55.4%, a difference of 0.050%), Immigrants from Nicaragua (55.4%, a difference of 0.070%), Immigrants from Cuba (55.3%, a difference of 0.12%), and Menominee (55.3%, a difference of 0.15%).
| Demographics | Rating | Rank | 2 or more Vehicles in Household |
| Paiute | 68.0 /100 | #159 | Good 55.8% |
| Crow | 67.0 /100 | #160 | Good 55.7% |
| Colville | 61.1 /100 | #161 | Good 55.6% |
| German Russians | 60.9 /100 | #162 | Good 55.6% |
| Immigrants | Zimbabwe | 60.2 /100 | #163 | Good 55.6% |
| Dutch West Indians | 59.8 /100 | #164 | Average 55.6% |
| Immigrants | El Salvador | 59.4 /100 | #165 | Average 55.6% |
| Immigrants | Sri Lanka | 58.3 /100 | #166 | Average 55.5% |
| Kenyans | 58.1 /100 | #167 | Average 55.5% |
| French American Indians | 56.7 /100 | #168 | Average 55.5% |
| Immigrants | Austria | 56.3 /100 | #169 | Average 55.5% |
| Romanians | 55.8 /100 | #170 | Average 55.5% |
| Immigrants | Costa Rica | 54.4 /100 | #171 | Average 55.4% |
| Immigrants | Nicaragua | 51.6 /100 | #172 | Average 55.4% |
| Immigrants | Western Europe | 51.4 /100 | #173 | Average 55.4% |
| Navajo | 50.0 /100 | #174 | Average 55.3% |
| Immigrants | Denmark | 49.4 /100 | #175 | Average 55.3% |
| Immigrants | Cuba | 47.0 /100 | #176 | Average 55.3% |
| Menominee | 46.2 /100 | #177 | Average 55.3% |
| Immigrants | Sweden | 45.3 /100 | #178 | Average 55.2% |
| Alaskan Athabascans | 42.9 /100 | #179 | Average 55.2% |