Chickasaw vs Immigrants from Spain 4 or more Vehicles in Household
COMPARE
Chickasaw
Immigrants from Spain
4 or more Vehicles in Household
4 or more Vehicles in Household Comparison
Chickasaw
Immigrants from Spain
7.4%
4 OR MORE VEHICLES IN HOUSEHOLD
99.9/ 100
METRIC RATING
71st/ 347
METRIC RANK
5.4%
4 OR MORE VEHICLES IN HOUSEHOLD
0.3/ 100
METRIC RATING
282nd/ 347
METRIC RANK
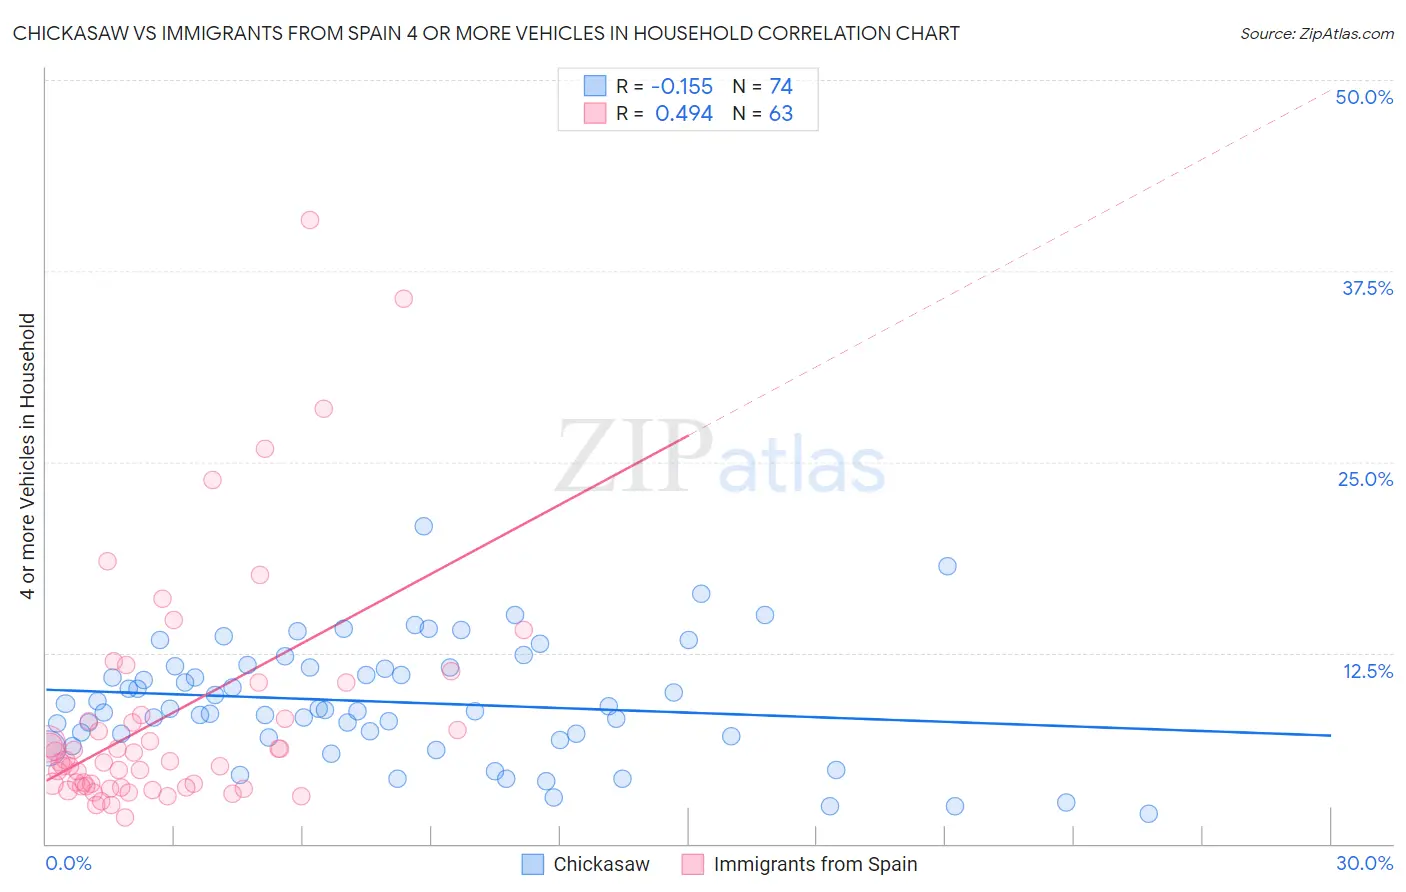
Chickasaw vs Immigrants from Spain 4 or more Vehicles in Household Correlation Chart
The statistical analysis conducted on geographies consisting of 147,524,339 people shows a poor negative correlation between the proportion of Chickasaw and percentage of households with 4 or more vehicles available in the United States with a correlation coefficient (R) of -0.155 and weighted average of 7.4%. Similarly, the statistical analysis conducted on geographies consisting of 238,415,926 people shows a moderate positive correlation between the proportion of Immigrants from Spain and percentage of households with 4 or more vehicles available in the United States with a correlation coefficient (R) of 0.494 and weighted average of 5.4%, a difference of 37.8%.
4 or more Vehicles in Household Correlation Summary
| Measurement | Chickasaw | Immigrants from Spain |
| Minimum | 2.0% | 1.7% |
| Maximum | 20.8% | 40.8% |
| Range | 18.8% | 39.1% |
| Mean | 9.3% | 8.4% |
| Median | 8.8% | 5.4% |
| Interquartile 25% (IQ1) | 7.0% | 3.7% |
| Interquartile 75% (IQ3) | 11.5% | 8.4% |
| Interquartile Range (IQR) | 4.5% | 4.7% |
| Standard Deviation (Sample) | 3.8% | 7.8% |
| Standard Deviation (Population) | 3.8% | 7.8% |
Similar Demographics by 4 or more Vehicles in Household
Demographics Similar to Chickasaw by 4 or more Vehicles in Household
In terms of 4 or more vehicles in household, the demographic groups most similar to Chickasaw are Scottish (7.4%, a difference of 0.13%), German (7.5%, a difference of 0.20%), Scotch-Irish (7.4%, a difference of 0.30%), Portuguese (7.4%, a difference of 0.39%), and Icelander (7.4%, a difference of 0.69%).
| Demographics | Rating | Rank | 4 or more Vehicles in Household |
| Bangladeshis | 100.0 /100 | #64 | Exceptional 7.6% |
| Immigrants | Azores | 100.0 /100 | #65 | Exceptional 7.5% |
| Immigrants | Taiwan | 99.9 /100 | #66 | Exceptional 7.5% |
| Americans | 99.9 /100 | #67 | Exceptional 7.5% |
| Welsh | 99.9 /100 | #68 | Exceptional 7.5% |
| Germans | 99.9 /100 | #69 | Exceptional 7.5% |
| Scottish | 99.9 /100 | #70 | Exceptional 7.4% |
| Chickasaw | 99.9 /100 | #71 | Exceptional 7.4% |
| Scotch-Irish | 99.9 /100 | #72 | Exceptional 7.4% |
| Portuguese | 99.9 /100 | #73 | Exceptional 7.4% |
| Icelanders | 99.9 /100 | #74 | Exceptional 7.4% |
| Immigrants | Cambodia | 99.9 /100 | #75 | Exceptional 7.4% |
| Laotians | 99.9 /100 | #76 | Exceptional 7.4% |
| Apache | 99.9 /100 | #77 | Exceptional 7.4% |
| Whites/Caucasians | 99.8 /100 | #78 | Exceptional 7.4% |
Demographics Similar to Immigrants from Spain by 4 or more Vehicles in Household
In terms of 4 or more vehicles in household, the demographic groups most similar to Immigrants from Spain are Immigrants from Ireland (5.4%, a difference of 0.080%), Immigrants from Western Africa (5.4%, a difference of 0.17%), Alsatian (5.4%, a difference of 0.24%), Immigrants from Uruguay (5.4%, a difference of 0.25%), and Brazilian (5.4%, a difference of 0.37%).
| Demographics | Rating | Rank | 4 or more Vehicles in Household |
| Cambodians | 0.5 /100 | #275 | Tragic 5.5% |
| Immigrants | Latvia | 0.5 /100 | #276 | Tragic 5.5% |
| Immigrants | Bulgaria | 0.5 /100 | #277 | Tragic 5.5% |
| Immigrants | Eastern Europe | 0.4 /100 | #278 | Tragic 5.4% |
| Immigrants | Uruguay | 0.3 /100 | #279 | Tragic 5.4% |
| Alsatians | 0.3 /100 | #280 | Tragic 5.4% |
| Immigrants | Western Africa | 0.3 /100 | #281 | Tragic 5.4% |
| Immigrants | Spain | 0.3 /100 | #282 | Tragic 5.4% |
| Immigrants | Ireland | 0.3 /100 | #283 | Tragic 5.4% |
| Brazilians | 0.3 /100 | #284 | Tragic 5.4% |
| Immigrants | Liberia | 0.2 /100 | #285 | Tragic 5.4% |
| Immigrants | Colombia | 0.2 /100 | #286 | Tragic 5.4% |
| Immigrants | Croatia | 0.2 /100 | #287 | Tragic 5.4% |
| Venezuelans | 0.2 /100 | #288 | Tragic 5.3% |
| Immigrants | Bosnia and Herzegovina | 0.2 /100 | #289 | Tragic 5.3% |